

Question: please create a chart showcasing the growth rate and explain how you got it begin{tabular}{|l|r|r|r|} hline & 2019 & 2020 & 2021 hline Total
please create a chart showcasing the growth rate and explain how you got it
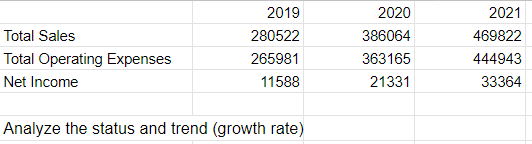
\begin{tabular}{|l|r|r|r|} \hline & 2019 & 2020 & 2021 \\ \hline Total Sales & 280522 & 386064 & 469822 \\ \hline Total Operating Expenses & 265981 & 363165 & 444943 \\ \hline Net Income & 11588 & 21331 & 33364 \\ \hline \end{tabular} Analyze the status and trend (growth rate)
Step by Step Solution
There are 3 Steps involved in it
1 Expert Approved Answer
Step: 1 Unlock

Question Has Been Solved by an Expert!
Get step-by-step solutions from verified subject matter experts
Step: 2 Unlock
Step: 3 Unlock