

Question: Please create a .csv file in excel and enter to following data to complete the problem. fProblem 1 A study was conducted to see if


Please create a .csv file in excel and enter to following data to complete the problem.
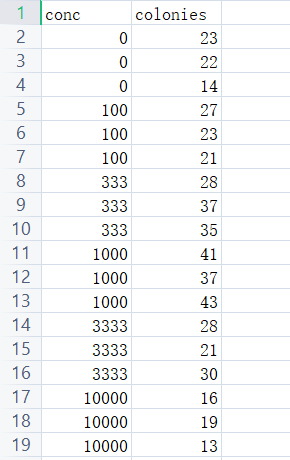
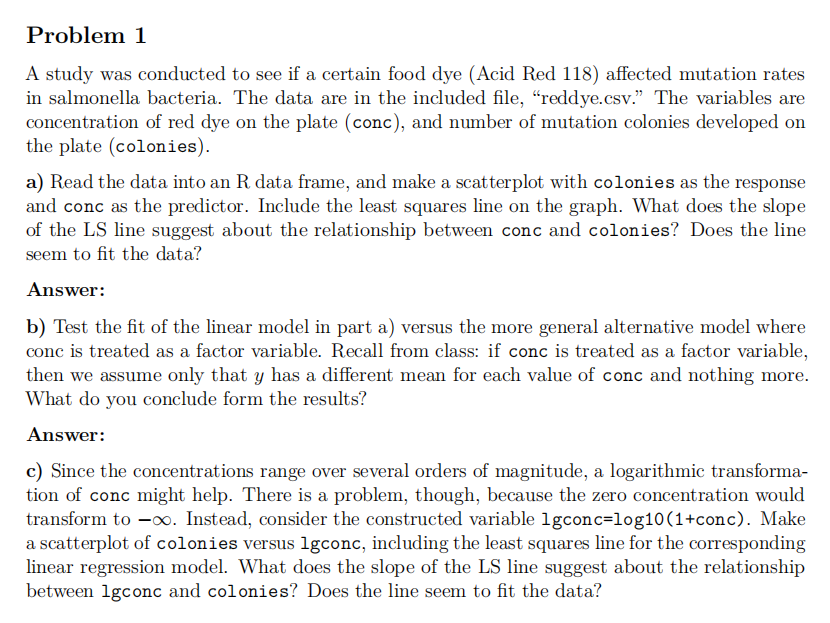
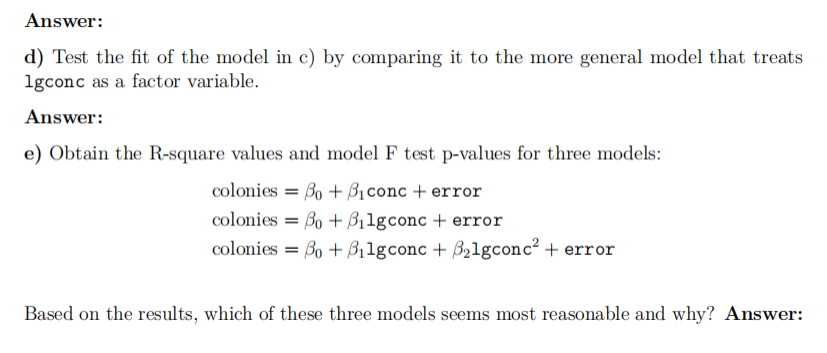
\fProblem 1 A study was conducted to see if a certain food dye [Acid Red 118) affected mutation rates in salmonella bacteria. The data are in the included le, \"reddyecsv.\" The variables are concentration of red dye on the plate (cone), and number of mutation colonies developed on the plate (colonies). a} Read the data into an R data frame, and make a scatterplot with colonies as the response and cone as the predictor. Include the least squares line on the graph. 'What does the slope of the LS line suggest about the relationship between cone and colonies? Does the line seem to t the data? Answer: b) Test the t of the linear model in part a) versus the more general alternative model where conc is treated as a factor variable. Recall from class: if conc is treated as a factor variable, then we assume only that 1,! has a different mean for each value of cone and nothing more. What do you conclude form the results? Answer: c) Since the concentrations range over several orders of magnitude, a logarithmic transjrnla- tion of cone might help. There is a problem, though, because the zero concentration would transform to 00. Instead, consider the constructed variable lgconc=loglOC1+conc). Make a scatterplot of colonies versus lgconc, including the least squares line for the corresponding linear regression model. What does the slope of the LS line suggest about the relationship between lgc one and colonies? Does the line seem to t the data? Answer: d) Test the t of the model in c) by comparing it to the more general model that treats lgconc as a factor variable. Answer: e) Obtain the Rsquare values and model F test pvalues for three models: colonies = 60 -+- 51mm: + error colonies = n + lls-acne + error colonies = 60 + llgconc + zlgcom:2 + error Based on the results, which of these three models seems most reasonable and Why
Step by Step Solution
There are 3 Steps involved in it

Get step-by-step solutions from verified subject matter experts