

Question: Please create a pivot table that looks like pic one using pic 2 numbers Id monthly Sparklines depicting the high & low years for each
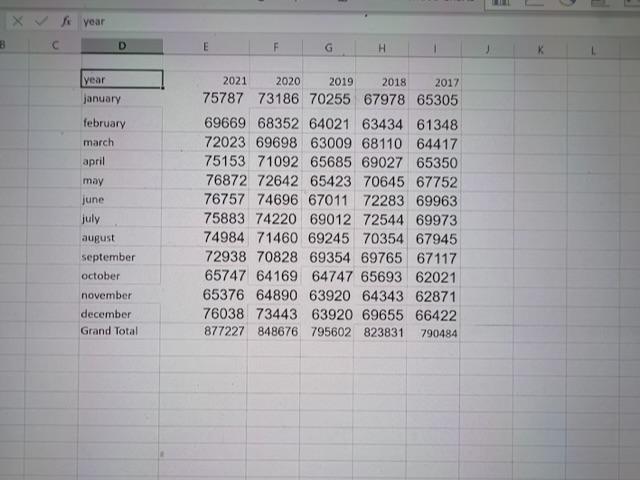
Please create a pivot table that looks like pic one using pic 2 numbers
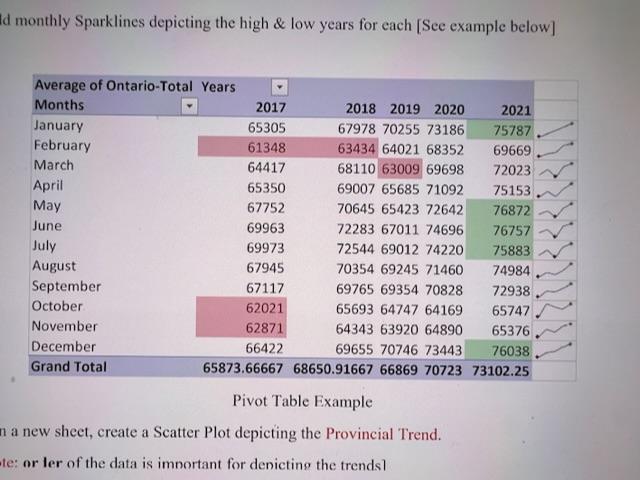
Id monthly Sparklines depicting the high \& low years for each [See example below] Pivot Table Example a new sheet, create a Scatter Plot depicting the Provincial Trend. te: or ler of the data is imnortant for denicting the trends]
Step by Step Solution
There are 3 Steps involved in it
1 Expert Approved Answer
Step: 1 Unlock

Question Has Been Solved by an Expert!
Get step-by-step solutions from verified subject matter experts
Step: 2 Unlock
Step: 3 Unlock