

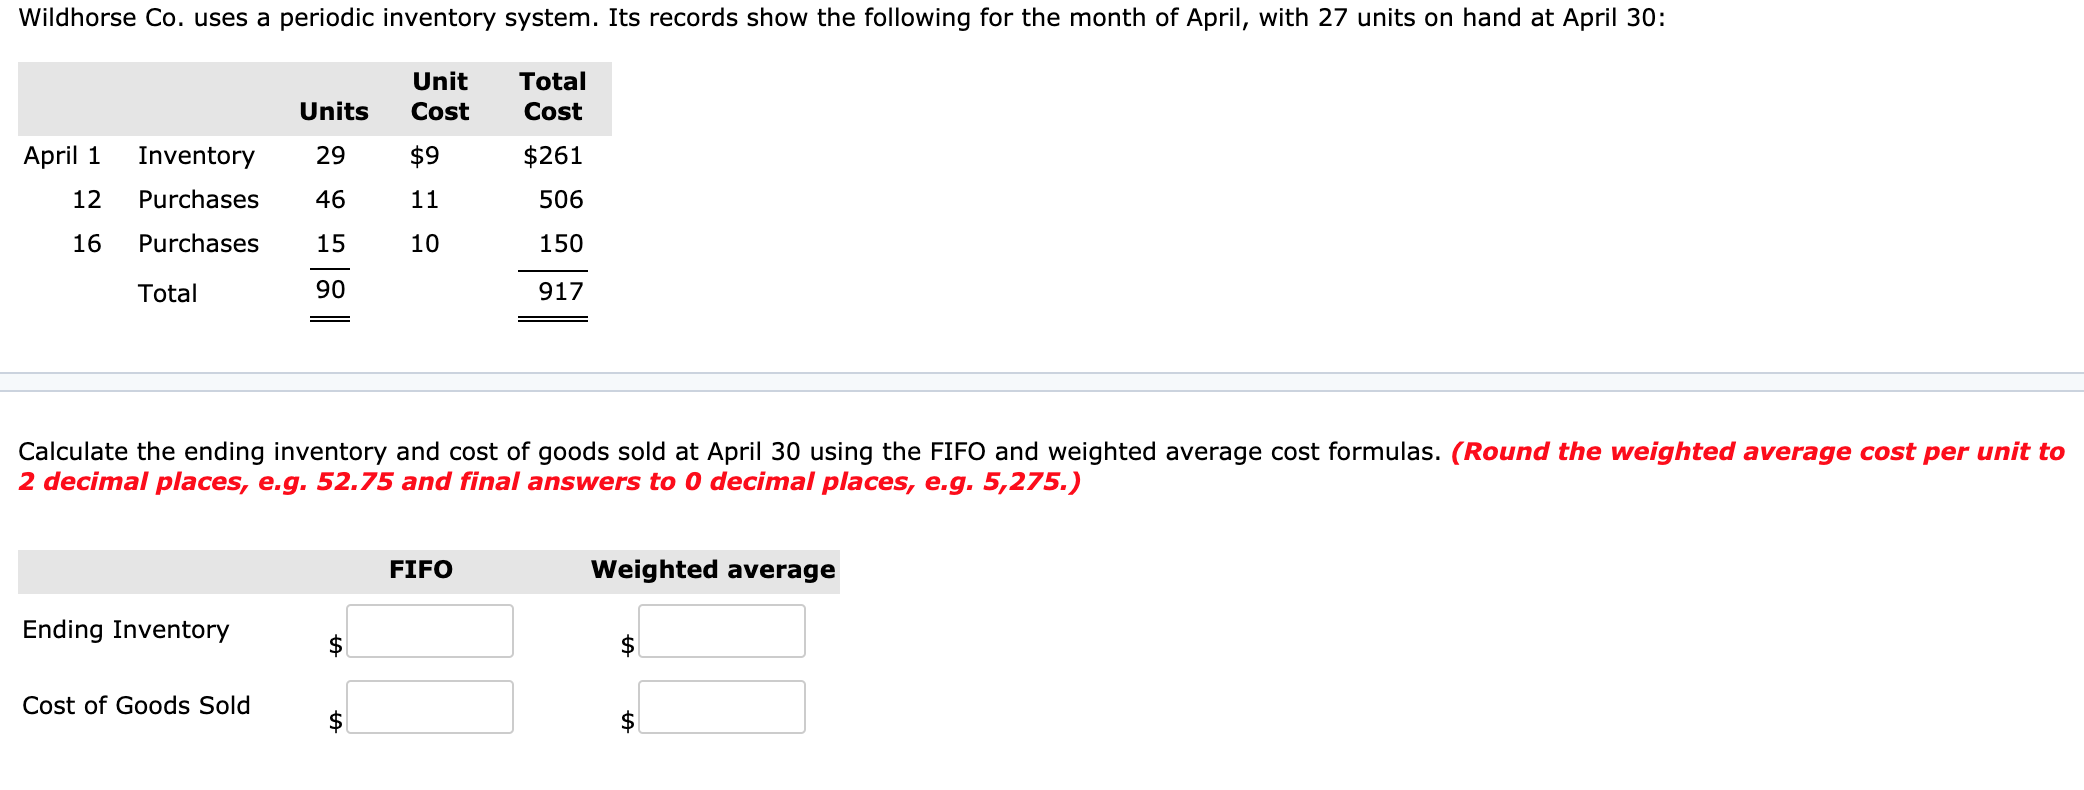
Question: Please create the same chart with same amount of boxes as in the picture Calculate the ending inventory and cost of goods sold at April
 Please create the same chart with same amount of boxes as in the picture
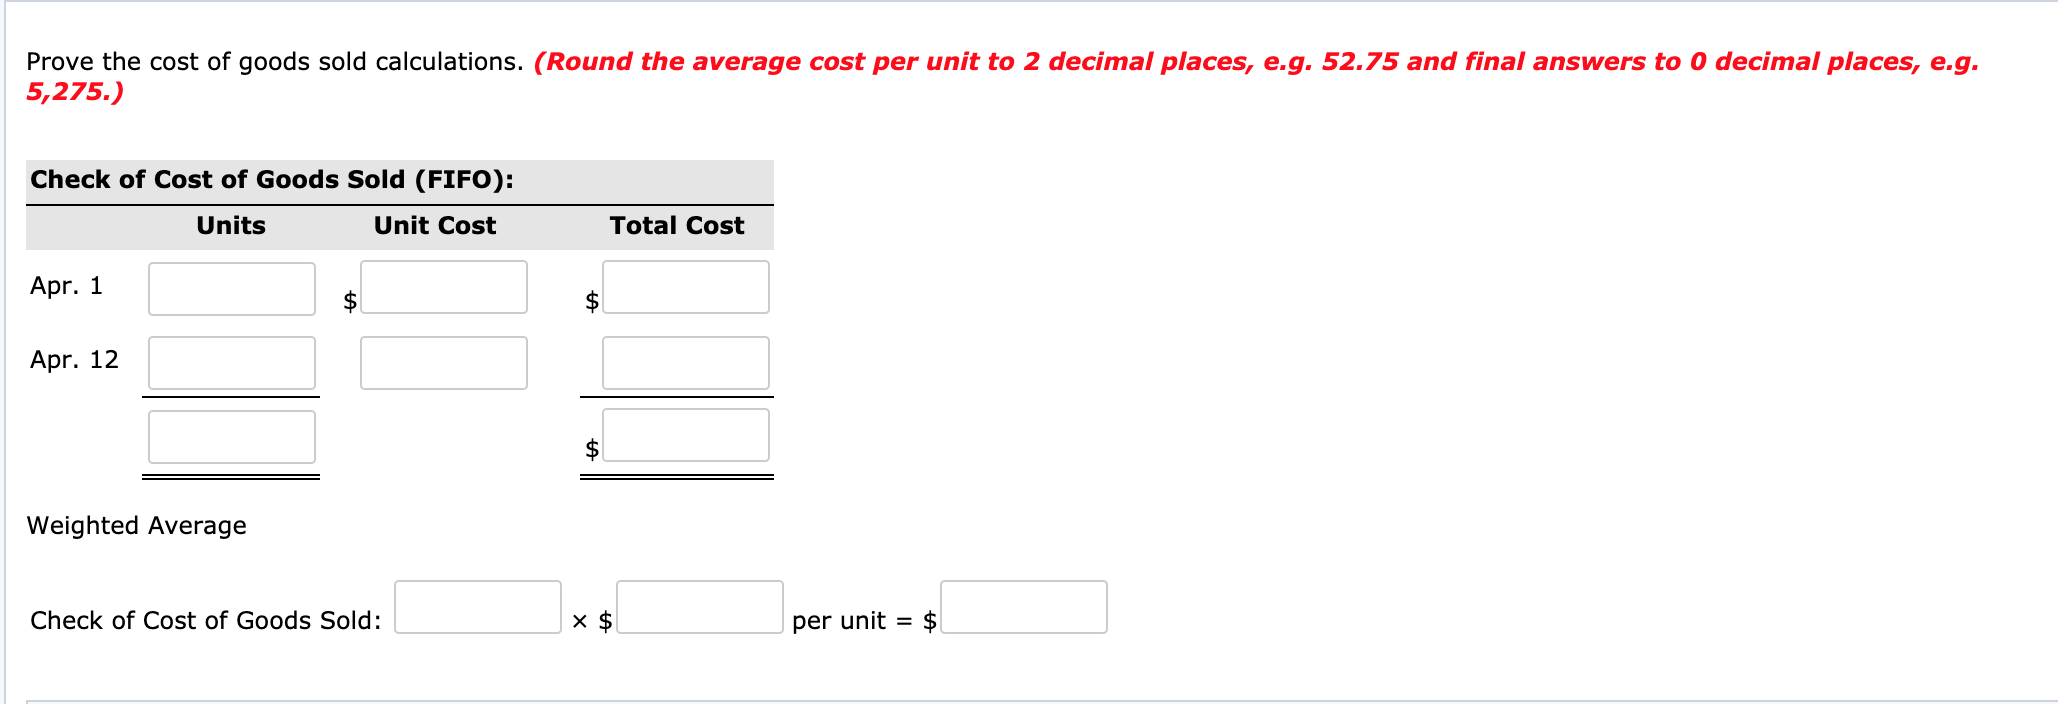
Calculate the ending inventory and cost of goods sold at April 30 using the FIFO and weighted average cost formulas. (Round the weighted average cost per unit to 2 decimal places, e.g. 52.75 and final answers to 0 decimal places, e.g. 5,275.) Prove the cost of goods sold calculations. (Round the average cost per unit to 2 decimal places, e.g. 52.75 and final answers to 0 decimal places, e.g. Prove the Weighted Average Check of Cost of Goods Sold: $perunit=$
Step by Step Solution
There are 3 Steps involved in it
1 Expert Approved Answer
Step: 1 Unlock

Question Has Been Solved by an Expert!
Get step-by-step solutions from verified subject matter experts
Step: 2 Unlock
Step: 3 Unlock