

Question: Please detailed showwork Q1. For the data given below: 136 150 126 184 146 137 194 126 139 163 189 188 165 176 197 127
Please detailed showwork
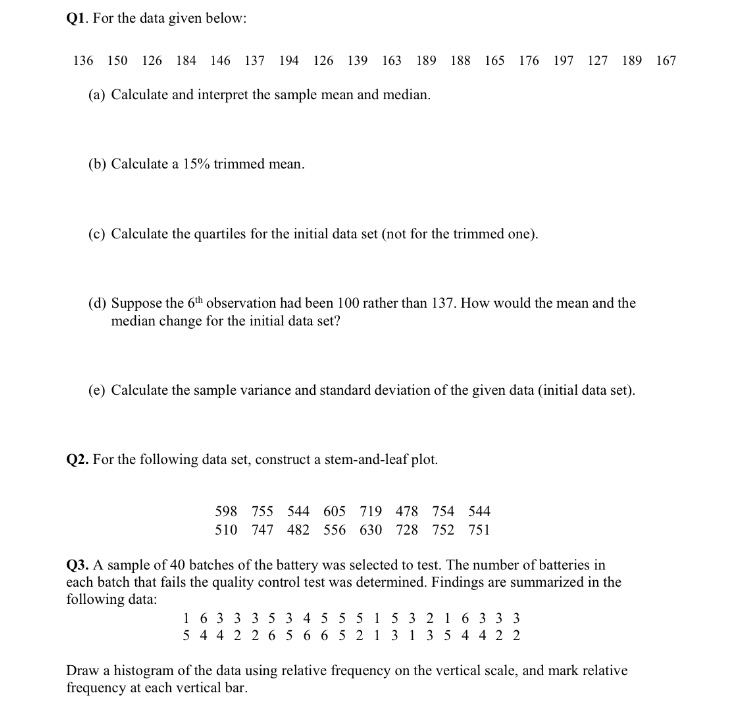
Q1. For the data given below: 136 150 126 184 146 137 194 126 139 163 189 188 165 176 197 127 189 167 (a) Calculate and interpret the sample mean and median. (b) Calculate a 15% trimmed mean. (c) Calculate the quartiles for the initial data set (not for the trimmed one). (d) Suppose the 6th observation had been 100 rather than 137. How would the mean and the median change for the initial data set? (e) Calculate the sample variance and standard deviation of the given data (initial data set). Q2. For the following data set, construct a stem-and-leaf plot. 598 755 544 605 719 478 754 544 510 747 482 556 630 728 752 751 Q3. A sample of 40 batches of the battery was selected to test. The number of batteries in each batch that fails the quality control test was determined. Findings are summarized in the following data: 1 6 3 3 3 5 3 4 5 4 4 2 2 656 65 5 13 1 3 5 4 4 2 2 Draw a histogram of the data using relative frequency on the vertical scale, and mark relative frequency at each vertical bar
Step by Step Solution
There are 3 Steps involved in it

Get step-by-step solutions from verified subject matter experts