

Question: Please develop this assignment please answer all the question ask if possible. Summarize the article in one paragraph: Answer the following questions about your table
Please develop this assignment please answer all the question ask if possible.
- Summarize the article in one paragraph:
- Answer the following questions about your table or graph.
- Whattypeof study is used in the article (quantitative or qualitative)?
- Explainhow you came to that conclusion.
- Whattypeof graph or table did you choose for your lab (bar graph, histogram, stem & leaf plot, etc.)?
- What characteristics make it this type (you should bring in material that you learned in the course)?
- Describethe data displayed in your frequency distribution or graph (consider class size, class width, total frequency, list of frequencies, class consistency, explanatory variables, response variables, shapes of distributions, etc.)
- Draw a conclusionabout the data from the graph or frequency distribution in the context of the article.
- Howelse might this data have been displayed?
- Discuss the pros and cons of2 other presentation options, such as tables or different graphical displays.
- Whydo you think those two other presentation options (i.e., tables or different graphs) werenotused in this article?
- Whattypeof study is used in the article (quantitative or qualitative)?
- Give the fullAPA referenceof the article you are using for this lab
Article
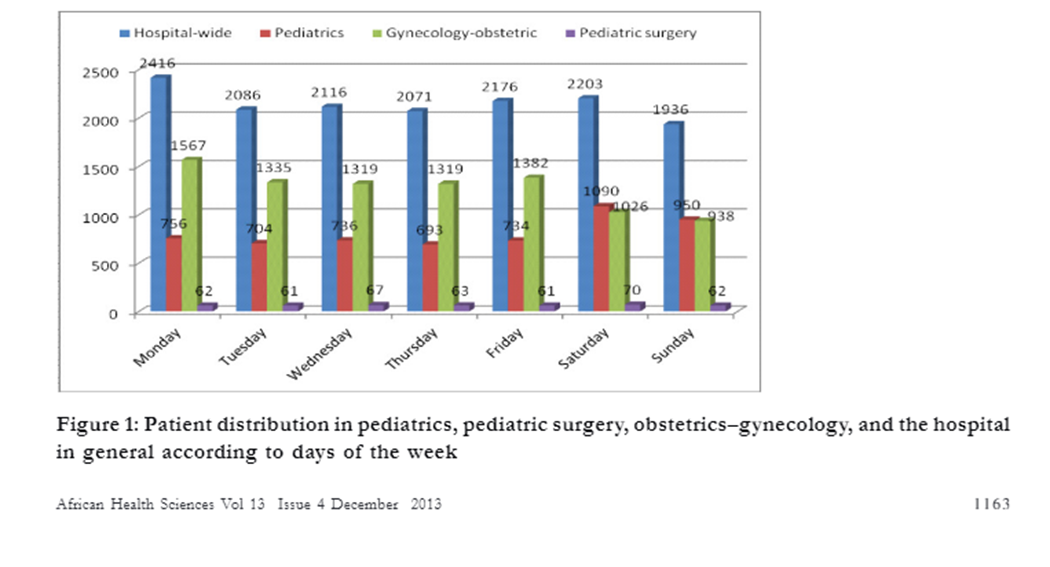
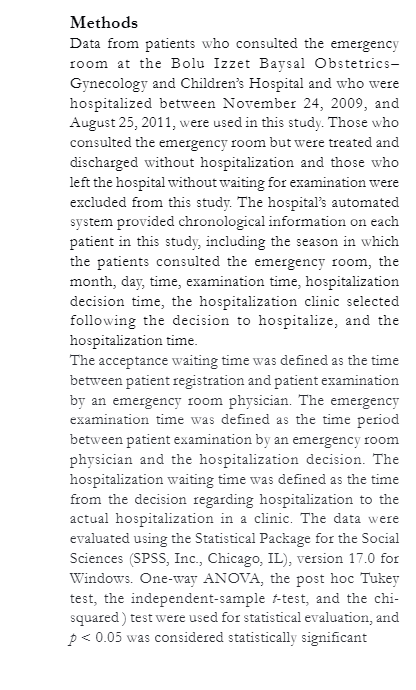
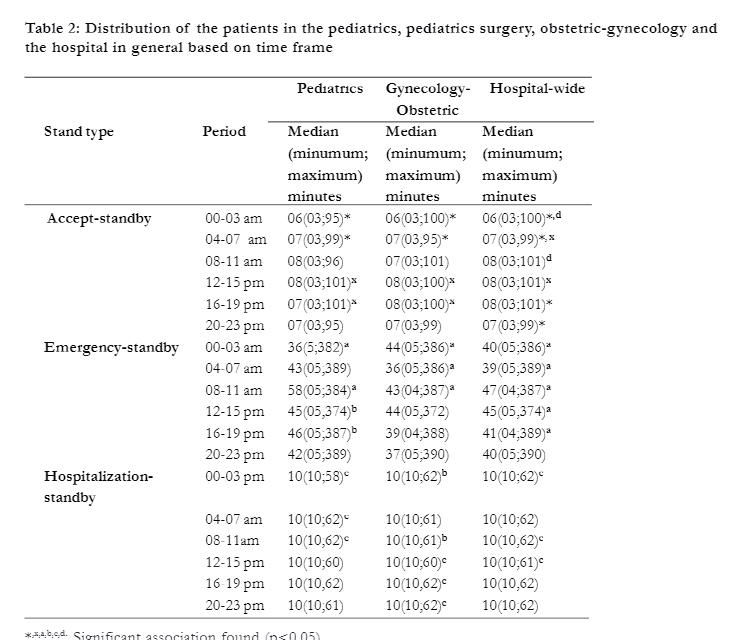
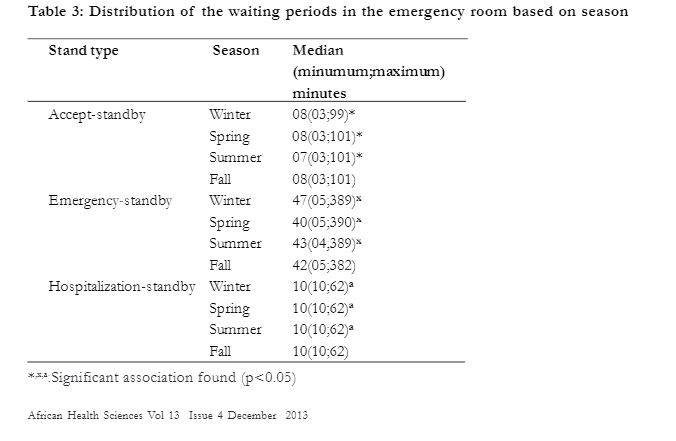
Hospital-wide Pediatrics Gynecology-obstetric . Pediatric surgery 2500 2416 2086 2116 2176 2203 2071 2000 1936 1567 1500 1335 1319 1319 1382 1090 1000 1026 950 756 938 704 693 734 500 2 53 Monday Tuesday Thursday Friday Wednesday Saturday Sunday Figure 1: Patient distribution in pediatrics, pediatric surgery, obstetrics-gynecology, and the hospital in general according to days of the week African Health Sciences Vol 13 Issue 4 December 2013 1 163Methods Data from patients who consulted the emergency room at the Bolu Izzet Baysal Obstetrics- Gynecology and Children's Hospital and who were hospitalized between November 24, 2009, and August 25, 2011, were used in this study. Those who consulted the emergency room but were treated and discharged without hospitalization and those who left the hospital without waiting for examination were excluded from this study. The hospital's automated system provided chronological information on each patient in this study, including the season in which the patients consulted the emergency room, the month, day, time, examination time, hospitalization decision time, the hospitalization clinic selected following the decision to hospitalize, and the hospitalization time. The acceptance waiting time was defined as the time between patient registration and patient examination by an emergency room physician. The emergency examination time was defined as the time period between patient examination by an emergency room physician and the hospitalization decision. The hospitalization waiting time was defined as the time from the decision regarding hospitalization to the actual hospitalization in a clinic. The data were evaluated using the Statistical Package for the Social Sciences (SPSS, Inc., Chicago, IL), version 17.0 for Windows. One-way ANOVA, the post hoc Tukey test, the independent-sample /-test, and the chi- squared ) test were used for statistical evaluation, and p 16-19 pm 07(03;101) 08(03;100) 08(03;101)* 20-23 pm 07(03;95) 07(03,99) 07(03,99)* Emergency-standby 00-03 am 36(5;382)2 44(05:386) 40(05;386)* 04-07 am 43(05,389) 36(05,386) 39(05;389)a 08-11 am 58(05;384) 43(04;387) 47(04;387)2 12-15 pm 45(05,374)b 44(05,372) 45(05,374)2 16-19 pm 46(05;387)b 39(04;388) 41 (04;389) 20-23 pm 42(05;389) 37(05;390) 40(05;390) Hospitalization- 00-03 pm 10(10;58)" 10(10;62)6 10(10;62) standby 04-07 am 10(10;62)" 10(10;61) 10(10;62) 08-11am 10(10,62)- 10(10,61) 10(10,62)- 12-15 pm 10(10;60) 10(10;60)- 10(10;61)c 16-19 pm 10(10,62) 10(10,62) 10(10,62) 20-23 pm 10(10;61) 10(10;62)c 10(10;62) *.3.abed. ciTable 3: Distribution of the waiting periods in the emergency room based on season Stand type Season Median (minumum;maximum) minutes Accept-standby Winter 08(03:99)* Spring 08(03:101)* Summer 07(03;101)* Fall 08(03:101) Emergency-standby Winter 47(05;389)> Spring 40(05:390) Summer 43(04,389)> Fall 42(05;382) Hospitalization-standby Winter 10(10;62)2 Spring 10(10:62)a Summer 10(10;62)a Fall 10(10;62) *5.A Significant association found (p
Step by Step Solution
There are 3 Steps involved in it

Get step-by-step solutions from verified subject matter experts