

Question: please do 1-10 and questions below 1-10 Descriptive/Inferential Statistics Review Due Monday, November 29 during class - correct responses will be posted on Monday night
please do 1-10 and questions below 1-10 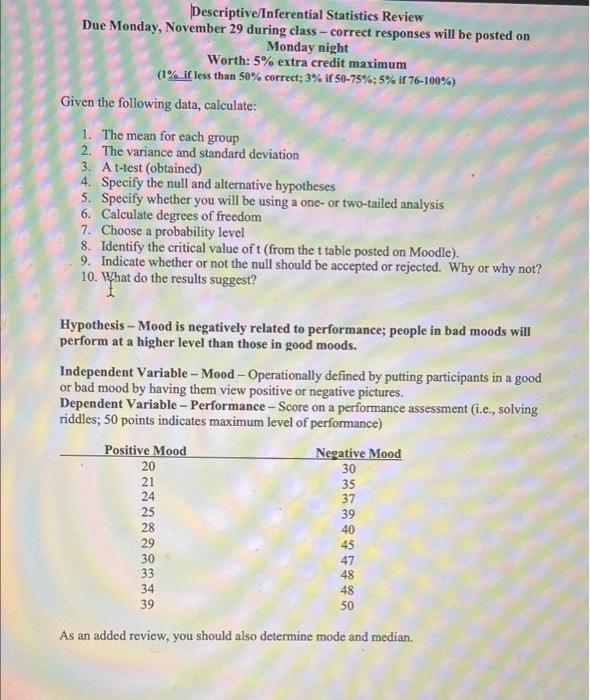
Descriptive/Inferential Statistics Review Due Monday, November 29 during class - correct responses will be posted on Monday night Worth: 5% extra credit maximum (1% if less than 50% correct; 3% if 50-75%-5% if 76-100%) Given the following data, calculate: 1. The mean for each group 2. The variance and standard deviation 3. A t-test (obtained) 4. Specify the null and alternative hypotheses 5. Specify whether you will be using a one-or two-tailed analysis 6. Calculate degrees of freedom 7. Choose a probability level 8. Identify the critical value oft (from the t table posted on Moodle). 9. Indicate whether or not the null should be accepted or rejected. Why or why not? 10. What do the results suggest? Hypothesis Mood is negatively related to performance; people in bad moods will perform at a higher level than those in good moods. Independent Variable - Mood - Operationally defined by putting participants in a good or bad mood by having them view positive or negative pictures. Dependent Variable - Performance - Score on a performance assessment (i.e., solving riddles; 50 points indicates maximum level of performance) Positive Mood Negative Mood 20 21 35 24 37 25 39 28 40 29 45 30 33 34 39 30 %% 47 48 48 50 As an added review, you should also determine mode and median Descriptive/Inferential Statistics Review Due Monday, November 29 during class - correct responses will be posted on Monday night Worth: 5% extra credit maximum (1% if less than 50% correct; 3% if 50-75%-5% if 76-100%) Given the following data, calculate: 1. The mean for each group 2. The variance and standard deviation 3. A t-test (obtained) 4. Specify the null and alternative hypotheses 5. Specify whether you will be using a one-or two-tailed analysis 6. Calculate degrees of freedom 7. Choose a probability level 8. Identify the critical value oft (from the t table posted on Moodle). 9. Indicate whether or not the null should be accepted or rejected. Why or why not? 10. What do the results suggest? Hypothesis Mood is negatively related to performance; people in bad moods will perform at a higher level than those in good moods. Independent Variable - Mood - Operationally defined by putting participants in a good or bad mood by having them view positive or negative pictures. Dependent Variable - Performance - Score on a performance assessment (i.e., solving riddles; 50 points indicates maximum level of performance) Positive Mood Negative Mood 20 21 35 24 37 25 39 28 40 29 45 30 33 34 39 30 %% 47 48 48 50 As an added review, you should also determine mode and median
Step by Step Solution
There are 3 Steps involved in it
1 Expert Approved Answer
Step: 1 Unlock

Question Has Been Solved by an Expert!
Get step-by-step solutions from verified subject matter experts
Step: 2 Unlock
Step: 3 Unlock