

Question: PLEASE DO 2 QUESTION For the questions related to control charts, you may need to use the following table (and you can find the same
PLEASE DO 2 QUESTION 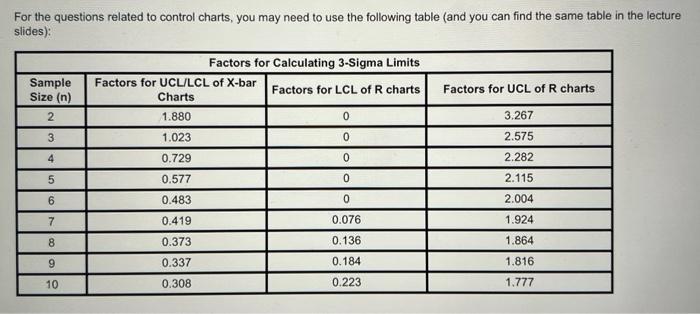
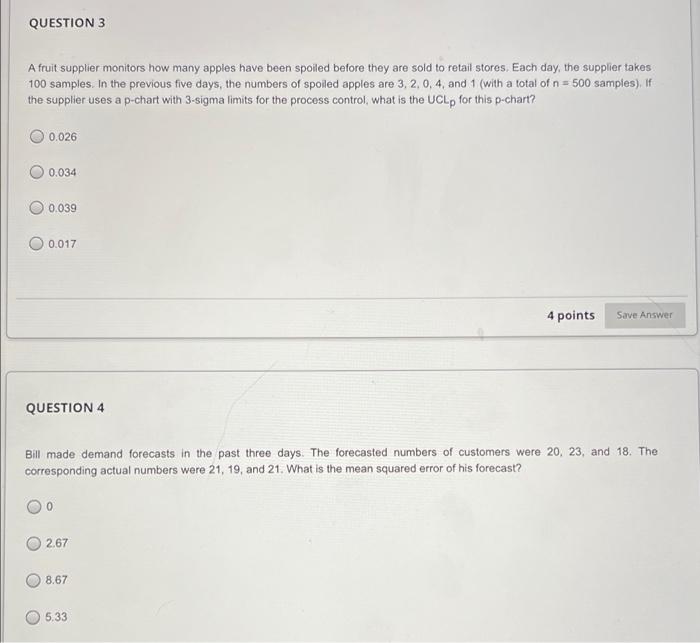
For the questions related to control charts, you may need to use the following table (and you can find the same table in the lecture slides): Sample Factors for Calculating 3-Sigma Limits Factors for UCL/LCL of X-bar Factors for LCL of R charts Charts 1.880 0 Factors for UCL of R charts Size (n) 2 3.267 3 0 2.575 4 1.023 0.729 0.577 0 2.282 5 0 2.115 6 0.483 0 2.004 0.419 0.076 1.924 00 0.136 1.864 0.373 0.337 9 0.184 1.816 1.777 10 0.308 0.223 QUESTION 3 A fruit supplier monitors how many apples have been spoiled before they are sold to retail stores. Each day, the supplier takes 100 samples. In the previous five days, the numbers of spoiled apples are 3, 2, 0, 4, and 1 (with a total of n = 500 samples). If the supplier uses a p-chart with 3-sigma limits for the process control, what is the UCLp for this p-chart? 0.026 0.034 0.039 0.017 4 points Save Answer QUESTION 4 Bill made demand forecasts in the past three days. The forecasted numbers of customers were 20, 23, and 18. The corresponding actual numbers were 21, 19, and 21. What is the mean squared error of his forecast? 0 2.67 8.67 5.33
Step by Step Solution
There are 3 Steps involved in it
1 Expert Approved Answer
Step: 1 Unlock

Question Has Been Solved by an Expert!
Get step-by-step solutions from verified subject matter experts
Step: 2 Unlock
Step: 3 Unlock