

Question: Please do #9 in Excel with formulas. Also how to add tangent line? money market fund that yields a sure rate of 5.5%. The probability
Please do #9 in Excel with formulas. Also how to add tangent line?
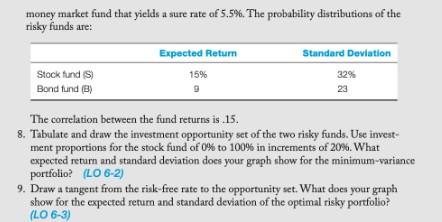
money market fund that yields a sure rate of 5.5%. The probability distributions of the risky funds are: Expected Return Standard Deviation Stock fund (S) 15% 32% Bond fund (8) 9 23 The correlation between the fund returns is .15. 8. Tabulate and draw the investment opportunity set of the two risky funds. Use invest- ment proportions for the stock fund of 0% to 100% in increments of 20%. What expected return and standard deviation does your graph show for the minimum-variance portfolio? (LO 6-2) 9. Draw a tangent from the risle-free rate to the opportunity set. What does your graph show for the expected return and standard deviation of the optimal risky portfolio? (LO 6-3)
Step by Step Solution
There are 3 Steps involved in it

Get step-by-step solutions from verified subject matter experts