

Question: Please do a financial analysis on these numbers, calculate the most important rations and tell us about the future of the company. The anvil, scale
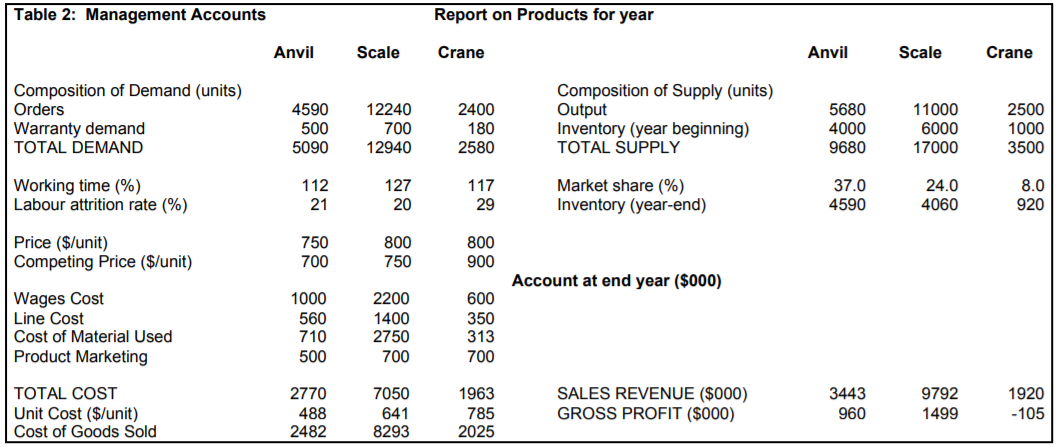
Please do a financial analysis on these numbers, calculate the most important rations and tell us about the future of the company. The anvil, scale and crane are different products of the company.
See see below for full info.
https://www.chegg.com/homework-help/questions-and-answers/question-analyse-acme-s-strategic-position-suggest-set-options-short-run-long-run-company--q83253414?trackid=rjqg62ht
and
https://www.chegg.com/homework-help/questions-and-answers/question-1-assess-situation-using-financial-strategic-analysis-firing-policy-likely-soluti-q83253385?trackid=rjqg62ht
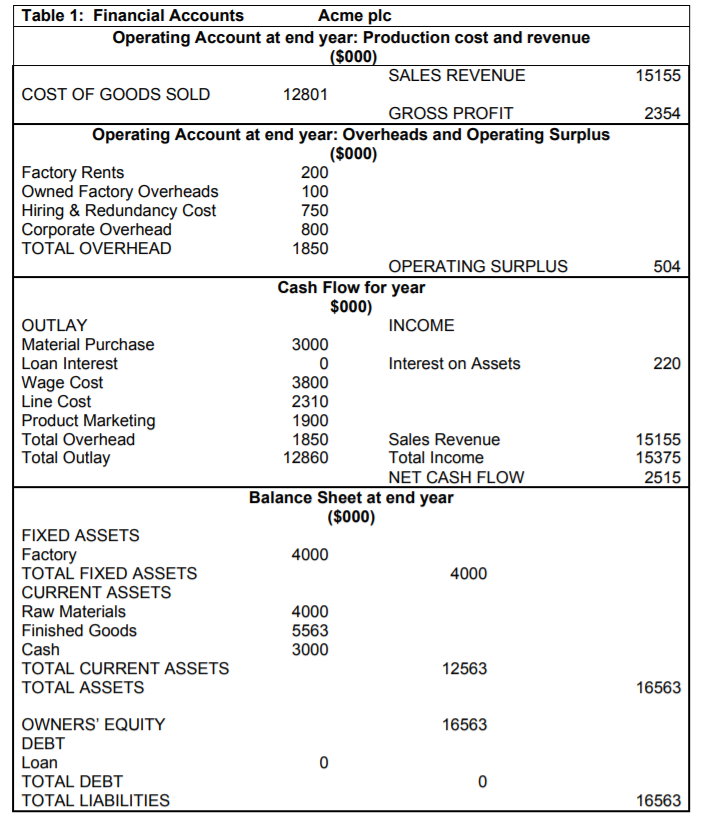
15155 2354 100 504 Table 1: Financial Accounts Acme plc Operating Account at end year: Production cost and revenue ($000) SALES REVENUE COST OF GOODS SOLD 12801 GROSS PROFIT Operating Account at end year: Overheads and Operating Surplus ($000) Factory Rents 200 Owned Factory Overheads Hiring & Redundancy Cost 750 Corporate Overhead 800 TOTAL OVERHEAD 1850 OPERATING SURPLUS Cash Flow for year $000) OUTLAY INCOME Material Purchase 3000 Loan Interest 0 Interest on Assets Wage Cost 3800 Line Cost 2310 Product Marketing 1900 Total Overhead 1850 Sales Revenue Total Outlay 12860 Total Income NET CASH FLOW Balance Sheet at end year ($000) FIXED ASSETS Factory 4000 TOTAL FIXED ASSETS 4000 CURRENT ASSETS Raw Materials 4000 Finished Goods 5563 Cash 3000 TOTAL CURRENT ASSETS 12563 TOTAL ASSETS 220 15155 15375 2515 16563 16563 OWNERS' EQUITY DEBT Loan TOTAL DEBT TOTAL LIABILITIES 0 0 16563 Table 2: Management Accounts Report on Products for year Anvil Scale Crane Anvil Scale Crane 11000 Composition of Demand (units) Orders Warranty demand TOTAL DEMAND 4590 500 5090 12240 700 12940 2400 180 2580 Composition of Supply (units) Output Inventory (year beginning) TOTAL SUPPLY 5680 4000 9680 6000 2500 1000 3500 17000 127 117 Working time (%) Labour attrition rate (%) 112 21 Market share (%) Inventory (year-end) 37.0 4590 24.0 4060 8.0 920 20 29 Price ($/unit) Competing Price ($/unit) 750 700 800 750 800 900 Account at end year ($000) Wages Cost Line Cost Cost of Material Used Product Marketing 1000 560 710 500 2200 1400 2750 700 600 350 313 700 TOTAL COST Unit Cost ($/unit) Cost of Goods Sold 2770 488 2482 7050 641 8293 1963 785 2025 SALES REVENUE ($000) GROSS PROFIT ($000) 3443 960 9792 1499 1920 - 105
Step by Step Solution
There are 3 Steps involved in it

Get step-by-step solutions from verified subject matter experts