

Question: Please do a variance analysis for below :- Try to break out the strategic profitability variances.. The Italian division is probably the most straight-forward of
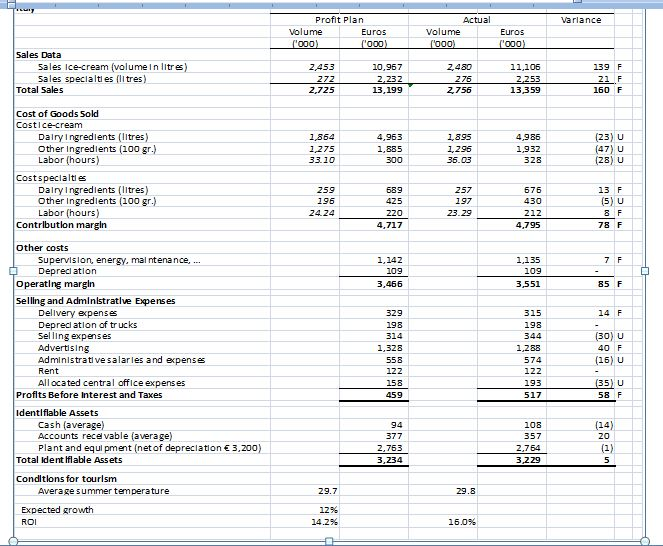
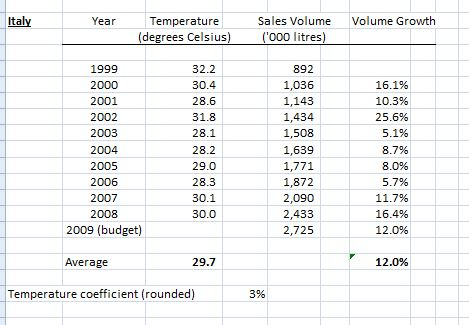
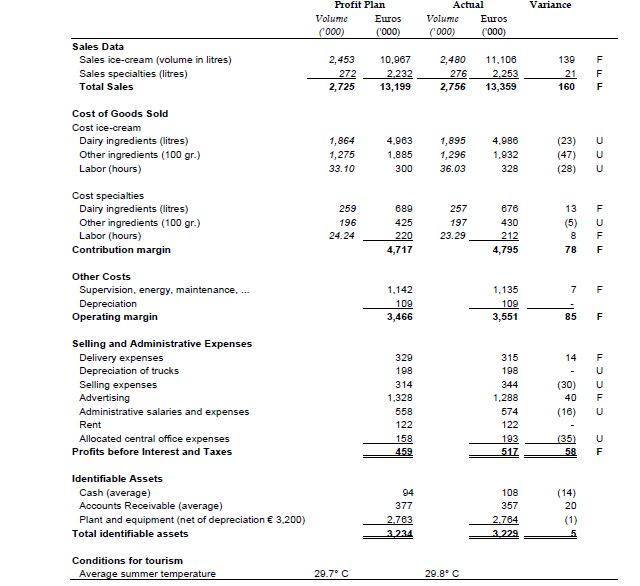
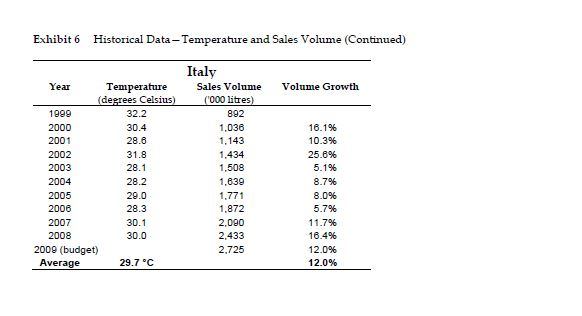
Please do a variance analysis for below :-
Try to break out the strategic profitability variances.. The Italian division is probably the most straight-forward of the three. Please do a full variance analysis for this division.
Show transcribed image text
Varlance Profit Plan Volume Euros ('000) ('000) Actual Volume Euros ('000) Sales Data Sales Ice-cream (volume in litres) Sales specialties (litres) Total Sales 2,453 10,967 2.232 13,199 222 2.725 2.480 275 2.756 11,105 2.253 13 359 139F 21 F 160 F Cost of Goods Sold Costice-cream Dalry ingredients (litres) Other Ingredients (100 gr.) Labor (hours) 4,953 1864 1.275 33.10 1.885 300 1,895 1,295 36.03 4,986 1.932 328 (23) U (47) U (28) U 259 Cost specialties Dalry Ingredients (litres) Other Ingredients (100 gr.) Labor (hours) Contribution margin 589 425 257 197 575 430 212 24.24 220 13 F (5) U & F 78 F 23.29 4,717 4,795 1,142 109 3,466 1,135 109 3,551 7 F - 85 F 329 14 F Other costs Supervision, energy, mal ntenance, Depreciation Operating margin Selling and Administrative Expenses Delivery expenses Depreciation of trucks Selling expenses Advertising Administrative salaries and expenses Rent Allocated central office expenses Profits Before Interest and Taxes 315 198 198 314 1,328 344 1.288 574 122 193 517 (30) U 40 F (16) U 558 122 158 459 (35) U 58 F 108 Identifiable Assets Cash average) Accounts recevable (average) Plant and equipment (net of depreciation 3,200) Total Identifiable Assets 377 2.763 3,234 357 2,754 3,229 Conditions for tourism Average summer temperature 29.7 29.8 Expected growth 12% 14.29 ROI 16.09 Italy Year Volume Growth Temperature (degrees Celsius) Sales Volume ('000 litres) 892 1,036 1,143 1,434 1,508 1999 2000 2001 2002 2003 2004 2005 2006 2007 2008 2009 (budget) 32.2 30.4 28.6 31.8 28.1 28.2 29.0 28.3 30.1 30.0 1,639 1,771 1,872 2,090 2,433 2,725 16.1% 10.3% 25.6% 5.1% 8.7% 8.0% 5.7% 11.7% 16.4% 12.0% Average 29.7 12.0% Temperature coefficient (rounded) 3% Variance Profit Plan Volume Euros (000) (000) Actual Volume Euros (000) (000) Sales Data Sales ice-cream (volume in litres) Sales specialties (litres) Total Sales 2,453 272 2,725 10.967 2.232 13,199 2,480 2 76_ 2,756 11,108 2.253 13,359 139F 21 160 F F Cost of Goods Sold Cost ice-cream Dairy ingredients (litres) Other ingredients (100 gr.) Labor (hours) 1,864 1,275 33.10 4.963 1.885 300 1,895 1,296 36.03 4.986 1.932 328 (23) (47) (28) CCC 13 F Cost specialties Dairy ingredients (litres) Other ingredients (100 gr.) Labor (hours) Contribution margin 259 196 24.24 889 425 220 4,717 676 430 212 4,795 23.29 TC Other Costs Supervision, energy, maintenance, ... Depreciation Operating margin 1,142 109 3,466 1.135 109 3,551 T Selling and Administrative Expenses Delivery expenses Depreciation of trucks Selling expenses Advertising Administrative salaries and expenses Rent Allocated central office expenses Profits before Interest and Taxes 329 198 314 1,328 558 122 315 198 344 1.288 574 122 TC CTCCT 158 459 108 Identifiable Assets Cash (average) Accounts Receivable (average) Plant and equipment (net of depreciation 3,200) Total identifiable assets 357 377 2.763 3.234 2.764 3.229 Conditions for tourism Average summer temperature 29.7C 29.8C Exhibit 6 Historical Data - Temperature and Sales Volume (Continued) Italy Sales Volume Volume Growth Year Temperature (degrees Celsius) 1999 32.2 2000 30.4 2001 28.6 2002 31.8 2003 28.1 2004 28.2 2005 29.0 2006 28.3 2007 30.1 2008 30.0 2000 (budget) Average 29.7 C 892 1.036 1.143 1.434 1.508 1.639 1.771 1.872 2.090 2.433 2.725 16.1% 10.3% 25.6% 5.1% 8.7% 5.7% 11.7% 16.4% 12.0% 12.0% Varlance Profit Plan Volume Euros ('000) ('000) Actual Volume Euros ('000) Sales Data Sales Ice-cream (volume in litres) Sales specialties (litres) Total Sales 2,453 10,967 2.232 13,199 222 2.725 2.480 275 2.756 11,105 2.253 13 359 139F 21 F 160 F Cost of Goods Sold Costice-cream Dalry ingredients (litres) Other Ingredients (100 gr.) Labor (hours) 4,953 1864 1.275 33.10 1.885 300 1,895 1,295 36.03 4,986 1.932 328 (23) U (47) U (28) U 259 Cost specialties Dalry Ingredients (litres) Other Ingredients (100 gr.) Labor (hours) Contribution margin 589 425 257 197 575 430 212 24.24 220 13 F (5) U & F 78 F 23.29 4,717 4,795 1,142 109 3,466 1,135 109 3,551 7 F - 85 F 329 14 F Other costs Supervision, energy, mal ntenance, Depreciation Operating margin Selling and Administrative Expenses Delivery expenses Depreciation of trucks Selling expenses Advertising Administrative salaries and expenses Rent Allocated central office expenses Profits Before Interest and Taxes 315 198 198 314 1,328 344 1.288 574 122 193 517 (30) U 40 F (16) U 558 122 158 459 (35) U 58 F 108 Identifiable Assets Cash average) Accounts recevable (average) Plant and equipment (net of depreciation 3,200) Total Identifiable Assets 377 2.763 3,234 357 2,754 3,229 Conditions for tourism Average summer temperature 29.7 29.8 Expected growth 12% 14.29 ROI 16.09 Italy Year Volume Growth Temperature (degrees Celsius) Sales Volume ('000 litres) 892 1,036 1,143 1,434 1,508 1999 2000 2001 2002 2003 2004 2005 2006 2007 2008 2009 (budget) 32.2 30.4 28.6 31.8 28.1 28.2 29.0 28.3 30.1 30.0 1,639 1,771 1,872 2,090 2,433 2,725 16.1% 10.3% 25.6% 5.1% 8.7% 8.0% 5.7% 11.7% 16.4% 12.0% Average 29.7 12.0% Temperature coefficient (rounded) 3% Variance Profit Plan Volume Euros (000) (000) Actual Volume Euros (000) (000) Sales Data Sales ice-cream (volume in litres) Sales specialties (litres) Total Sales 2,453 272 2,725 10.967 2.232 13,199 2,480 2 76_ 2,756 11,108 2.253 13,359 139F 21 160 F F Cost of Goods Sold Cost ice-cream Dairy ingredients (litres) Other ingredients (100 gr.) Labor (hours) 1,864 1,275 33.10 4.963 1.885 300 1,895 1,296 36.03 4.986 1.932 328 (23) (47) (28) CCC 13 F Cost specialties Dairy ingredients (litres) Other ingredients (100 gr.) Labor (hours) Contribution margin 259 196 24.24 889 425 220 4,717 676 430 212 4,795 23.29 TC Other Costs Supervision, energy, maintenance, ... Depreciation Operating margin 1,142 109 3,466 1.135 109 3,551 T Selling and Administrative Expenses Delivery expenses Depreciation of trucks Selling expenses Advertising Administrative salaries and expenses Rent Allocated central office expenses Profits before Interest and Taxes 329 198 314 1,328 558 122 315 198 344 1.288 574 122 TC CTCCT 158 459 108 Identifiable Assets Cash (average) Accounts Receivable (average) Plant and equipment (net of depreciation 3,200) Total identifiable assets 357 377 2.763 3.234 2.764 3.229 Conditions for tourism Average summer temperature 29.7C 29.8C Exhibit 6 Historical Data - Temperature and Sales Volume (Continued) Italy Sales Volume Volume Growth Year Temperature (degrees Celsius) 1999 32.2 2000 30.4 2001 28.6 2002 31.8 2003 28.1 2004 28.2 2005 29.0 2006 28.3 2007 30.1 2008 30.0 2000 (budget) Average 29.7 C 892 1.036 1.143 1.434 1.508 1.639 1.771 1.872 2.090 2.433 2.725 16.1% 10.3% 25.6% 5.1% 8.7% 5.7% 11.7% 16.4% 12.0% 12.0%
Step by Step Solution
There are 3 Steps involved in it

Get step-by-step solutions from verified subject matter experts