

Question: please do all and i will rate 5 star, thank you! L. Janice Sanders, CEO of Pine Crest Medical Clinic, is concerned over the number
please do all and i will rate 5 star, thank you! 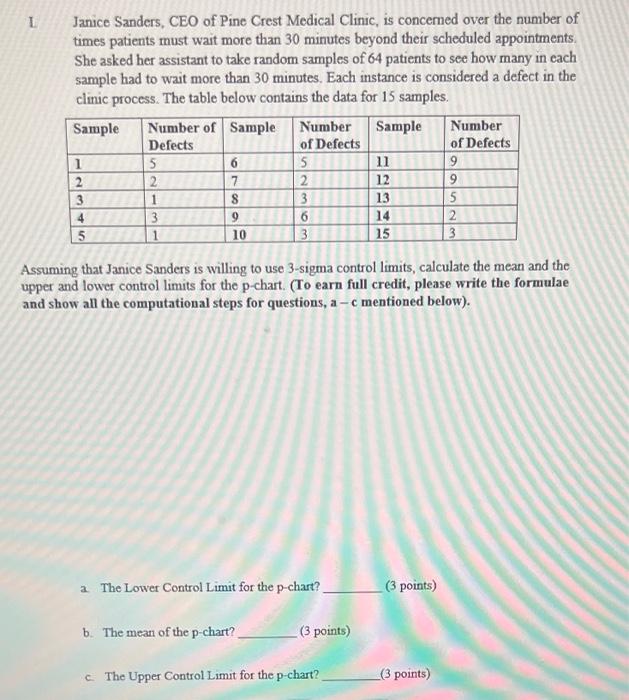
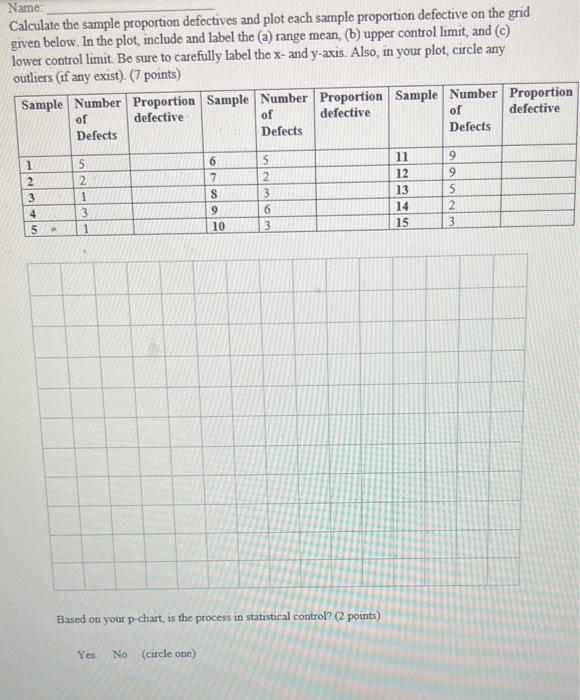
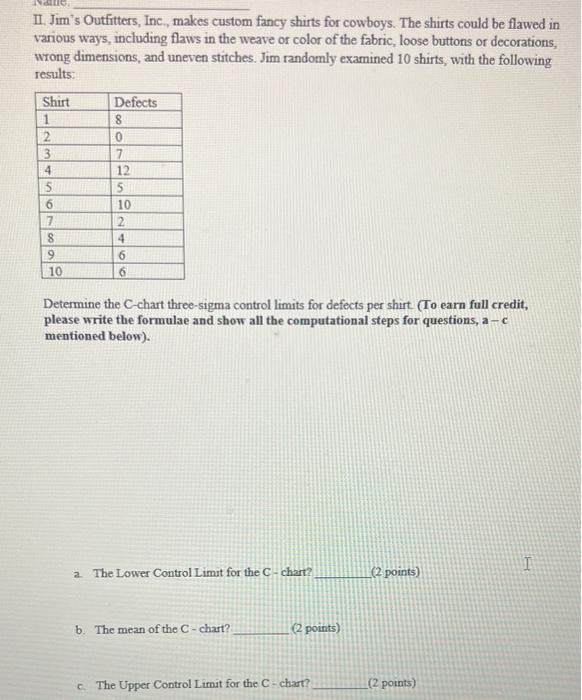
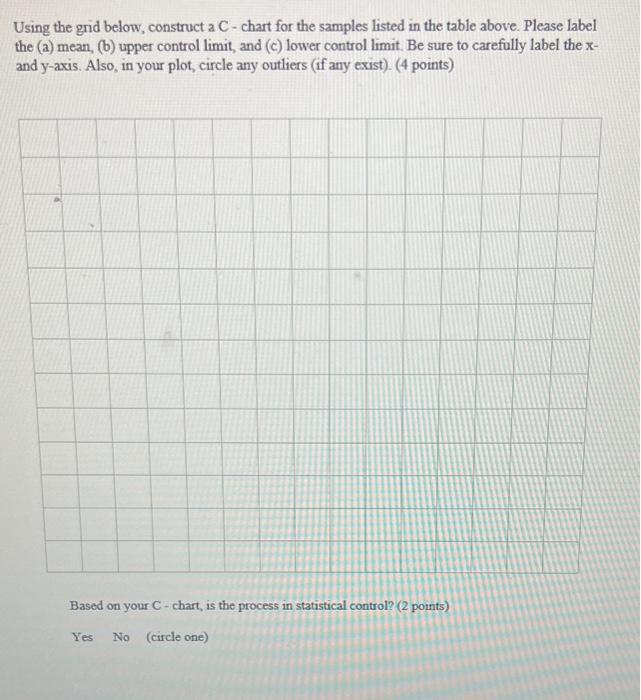
L. Janice Sanders, CEO of Pine Crest Medical Clinic, is concerned over the number of times patients must wait more than 30 minutes beyond their scheduled appointments. She asked her assistant to take random samples of 64 patients to see how many in each sample had to wait more than 30 minutes. Each instance is considered a defect in the clinic process. The table below contains the data for 15 samples. Assuming that Janice Sanders is willing to use 3 -sigma control limits, calculate the mean and the upper and lower control limits for the p-chart. (To earn full credit, please write the formulae and show all the computational steps for questions, a - c mentioned below). a. The Lower Control Limit for the p-chart? (3 points) b. The mean of the p-chart? (3 points) c. The Upper Control Limit for the p-chart? ( 3 points) Name: Calculate the sample proportion defectives and plot each sample proportion defective on the grid given below. In the plot, include and label the (a) range mean, (b) upper control limit, and (c) lower control limit. Be sure to carefully label the x - and y-axis. Also, in your plot, circle any mutliers (if anv exist). (7 points) Based on your p-chart, is the process in statistical control? (2 points) II. Jim's Outfitters, Inc, makes custom fancy shirts for cowboys. The shirts could be flawed in various ways, including flaws in the weave or color of the fabric, loose buttons or decorations, wrong dimensions, and uneven stitches. Jim randomly examined 10 shirts, with the following results: Determine the C-chart three-sigma control limits for defects per shirt. (To earn full credit, please write the formulae and show all the computational steps for questions, a-c mentioned below). a. The Lower Control Limit for the C - chart? 2points) b. The mean of the C-chart? (2 points) c. The Upper Control Limit for tho C-chart? (2 points) Using the grid below, construct a C - chart for the samples listed in the table above. Please label the (a) mean, (b) upper control limit, and (c) lower control limit. Be sure to carefully label the xand y-axis. Also, in your plot, circle any outliers (if any exist). (4 points) Based on your C - chart, is the process in statistical control? ( 2 points) Yes No (circle one)
Step by Step Solution
There are 3 Steps involved in it
1 Expert Approved Answer
Step: 1 Unlock

Question Has Been Solved by an Expert!
Get step-by-step solutions from verified subject matter experts
Step: 2 Unlock
Step: 3 Unlock