

Question: Please do all and not just one. If you can't do it then please don't do just one leave the rest undone. This is the
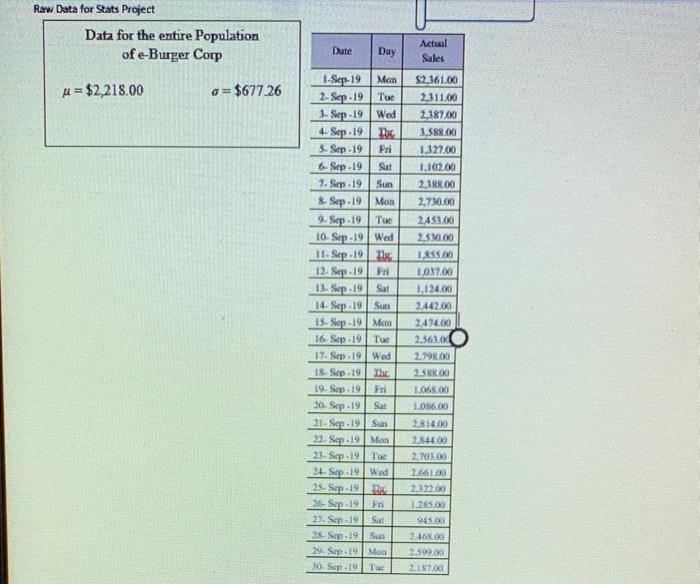

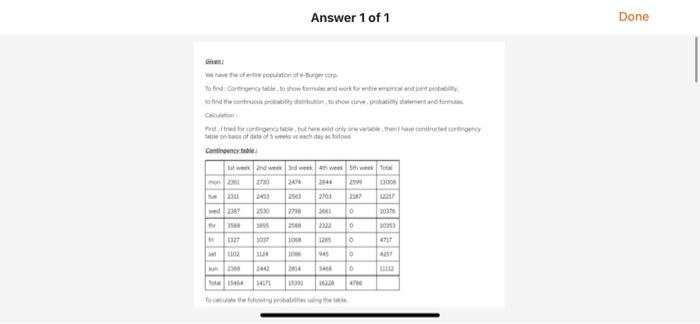
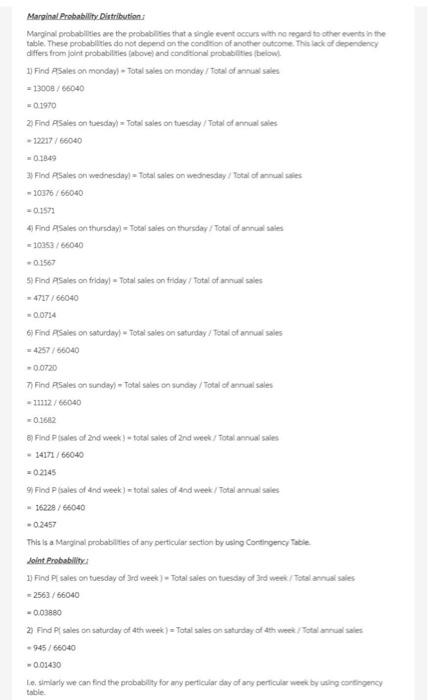
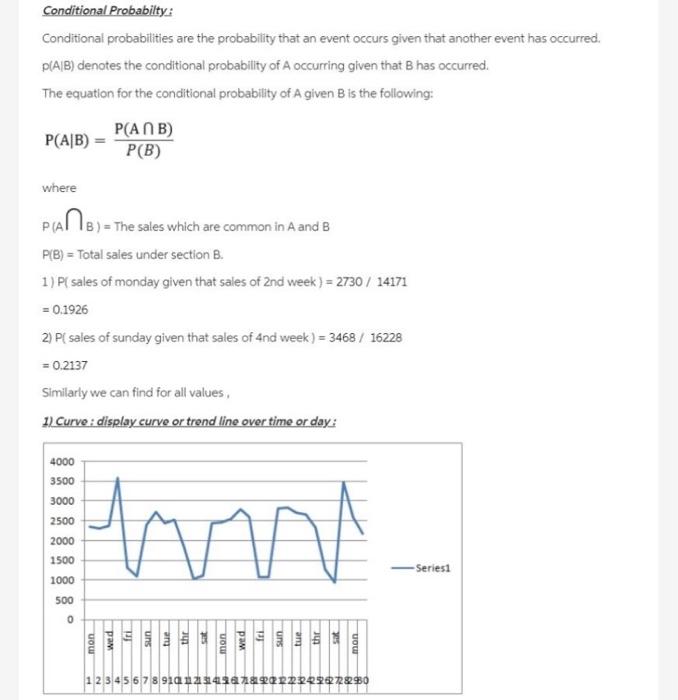
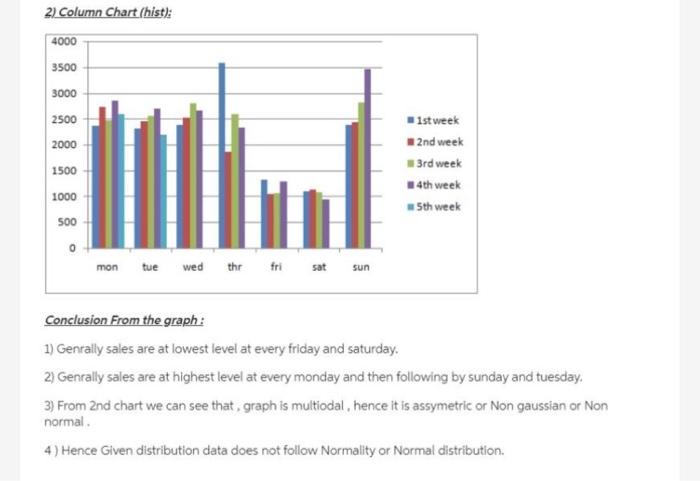
Raw Data for Stats Project Data for the entire Population of e-Burger Corp Date Day Actual Sales u = $2,218.00 a= $677.26 1-Sep-19 Man 2. Sep 19 Tue 1. Sep-19 Wed 4. Sep 19 Dhe 3. Sep - 19 Pri 6-Sep-19 Sat 2Sep-19 Sun & Sep-19 Mon 9. Sep -19 Tue 10 Sep.19 Wed 11. Sep 19 12. Sep 19 Pri 11. Sep.19 Sat 14. Scp-19 Sun 15. Sop:19 Mon 16. Sep 19 Tue 17Sep-19 Wed 18 Sep 19 Dic 19. Sep. 19 Pri 20. Sop-19 Sat 21. Sop-19 Sun 22. Sep 19 Man 21. Sep -19 Tue 24. Sap-10 Wed 25 Sep 19 26. Sep 19 Fri 29. Sep 19 Sut 38. Sep 19 Su 2-Sep-19 Men 10. Sep-19 Tue $2.361.00 2.111.00 2.187.00 3,588.00 1.127.00 1,102.00 2.388.00 2,720.00 2.450.00 2.590.00 1.855.00 1.037.00 1.124.00 2.442.00 2.474.00 25630 2.798.00 280.00 1.068.00 1.056,00 2314.00 2844.00 2.100 2661.00 2.122.00 125.00 945. 2.468.00 2.599.00 21. VIL Confidence Interval (Chap work, and with Management Summary) Show work and of course, the illustration VIII Hypothess Testing (Chap 10 watk end with Management Summonry Make a statement about Ji And then use the correct process to teject or fitil to inject Use the step process with Cotab IX Conclusion Keep this simple (1) Gatis & dumlay all ball Management Sum) from the previstice and thermal ummary of this veport Dil this store perform expected Answer 1 of 1 Done water Tatiedot show formie bed the controly to show are probability and endom Pred they were totdat hy Contact and we 20 240 100 2001 ed2307 27 2011 30370 0 2007 10 12 0 ALT . 1102 200 16 0 BIE 141 Marginal Probability Distribution: Marginal probabilities are the probabies that a single event occurs with no regard to other events in the table. These probabilities do not depend on the condition of another outcome. The lack of dependency differs from joint probabilities above and conditional probabilities below 1) Find Sales on monday) - Total sales on Monday total of annus sales = 13008 / 66040 0.1970 2 Find Sales on tuesday) - Total sales on tuesday/Total of annual sales -12217766040 0.1849 3Find Sales on wednesday) - Total sales on wednesday / Total of animal des - 10376/66040 = 0.1572 41 Find Aales on thursday) - Total sales on thursday / Total af urencia sates =10253/66040 -0.1567 53 Find Aales on friday) - Total sales on friday / Total of annual sales 4727/66040 -0.0714 6) Find Sales on saturday Total sales on saturday: Total of annual sales +4257/66040 -0.0720 7 Find Aales on sunday) - Total sales on sunday / Total och annan soles - 11112/66040 01682 Find Psales of and wenk} total sales of and week/Total annual sales -14171/66040 = 0.2145 9) Find Psales of and week) = total sales of and week / Total annual sales 16229766040 -0.2457 This is a Marginal probabilities of any perticular section by using Cortingency Table saint. Probability 1) Find A sales on tuesday of Brd weet) - Total sales on tuesday of 3rd weekTots annual sales = 2563 / 66040 -0.03880 2) Find Psales on saturday of the week) Total sales on saturday of the week Total al sales 945 / 66040 -0.01430 1o, similarly we can find the probability for my perticular day of any perticular week by using contingency table Conditional Probabilty: Conditional probabilities are the probability that an event occurs given that another event has occurred. P(AIB) denotes the conditional probability of A occurring given that B has occurred. The equation for the conditional probability of A given B is the following: P(AB) = P(ANB) P(B) where PIANB) = th :) = The sales which are common in A and B P(B) = Total sales under section B. 1) P( sales of monday given that sales of 2nd week ) = 2730 / 14171 = 0.1926 2) PC sales of sunday given that sales of And week ) = 3468 / 16228 = 0.2137 Similarly we can find for all values, 1. Curve : display curve or trend line over time or day: 4000 3500 3000 2500 2000 1500 1000 500 mm . -Series 0 mon wed fri mon 1 2 3 4 5 6 7 8 9101 $ + * 1 2 2 2 2 4 29262728290 22 Column Chart (hist): 4000 3500 3000 2500 2000 1500 1st week * 2nd week 3rd week 24th week - 5th week 1000 500 mon tue wed thr fri sat sun Conclusion From the graph: 1) Genrally sales are at lowest level at every friday and saturday, 2) Genrally sales are at highest level at every monday and then following by sunday and tuesday. 3) From 2nd chart we can see that, graph is multiodal, hence it is assymetric or Non gaussian or Non normal 4) Hence Given distribution data does not follow Normality or Normal distribution. Raw Data for Stats Project Data for the entire Population of e-Burger Corp Date Day Actual Sales u = $2,218.00 a= $677.26 1-Sep-19 Man 2. Sep 19 Tue 1. Sep-19 Wed 4. Sep 19 Dhe 3. Sep - 19 Pri 6-Sep-19 Sat 2Sep-19 Sun & Sep-19 Mon 9. Sep -19 Tue 10 Sep.19 Wed 11. Sep 19 12. Sep 19 Pri 11. Sep.19 Sat 14. Scp-19 Sun 15. Sop:19 Mon 16. Sep 19 Tue 17Sep-19 Wed 18 Sep 19 Dic 19. Sep. 19 Pri 20. Sop-19 Sat 21. Sop-19 Sun 22. Sep 19 Man 21. Sep -19 Tue 24. Sap-10 Wed 25 Sep 19 26. Sep 19 Fri 29. Sep 19 Sut 38. Sep 19 Su 2-Sep-19 Men 10. Sep-19 Tue $2.361.00 2.111.00 2.187.00 3,588.00 1.127.00 1,102.00 2.388.00 2,720.00 2.450.00 2.590.00 1.855.00 1.037.00 1.124.00 2.442.00 2.474.00 25630 2.798.00 280.00 1.068.00 1.056,00 2314.00 2844.00 2.100 2661.00 2.122.00 125.00 945. 2.468.00 2.599.00 21. VIL Confidence Interval (Chap work, and with Management Summary) Show work and of course, the illustration VIII Hypothess Testing (Chap 10 watk end with Management Summonry Make a statement about Ji And then use the correct process to teject or fitil to inject Use the step process with Cotab IX Conclusion Keep this simple (1) Gatis & dumlay all ball Management Sum) from the previstice and thermal ummary of this veport Dil this store perform expected Answer 1 of 1 Done water Tatiedot show formie bed the controly to show are probability and endom Pred they were totdat hy Contact and we 20 240 100 2001 ed2307 27 2011 30370 0 2007 10 12 0 ALT . 1102 200 16 0 BIE 141 Marginal Probability Distribution: Marginal probabilities are the probabies that a single event occurs with no regard to other events in the table. These probabilities do not depend on the condition of another outcome. The lack of dependency differs from joint probabilities above and conditional probabilities below 1) Find Sales on monday) - Total sales on Monday total of annus sales = 13008 / 66040 0.1970 2 Find Sales on tuesday) - Total sales on tuesday/Total of annual sales -12217766040 0.1849 3Find Sales on wednesday) - Total sales on wednesday / Total of animal des - 10376/66040 = 0.1572 41 Find Aales on thursday) - Total sales on thursday / Total af urencia sates =10253/66040 -0.1567 53 Find Aales on friday) - Total sales on friday / Total of annual sales 4727/66040 -0.0714 6) Find Sales on saturday Total sales on saturday: Total of annual sales +4257/66040 -0.0720 7 Find Aales on sunday) - Total sales on sunday / Total och annan soles - 11112/66040 01682 Find Psales of and wenk} total sales of and week/Total annual sales -14171/66040 = 0.2145 9) Find Psales of and week) = total sales of and week / Total annual sales 16229766040 -0.2457 This is a Marginal probabilities of any perticular section by using Cortingency Table saint. Probability 1) Find A sales on tuesday of Brd weet) - Total sales on tuesday of 3rd weekTots annual sales = 2563 / 66040 -0.03880 2) Find Psales on saturday of the week) Total sales on saturday of the week Total al sales 945 / 66040 -0.01430 1o, similarly we can find the probability for my perticular day of any perticular week by using contingency table Conditional Probabilty: Conditional probabilities are the probability that an event occurs given that another event has occurred. P(AIB) denotes the conditional probability of A occurring given that B has occurred. The equation for the conditional probability of A given B is the following: P(AB) = P(ANB) P(B) where PIANB) = th :) = The sales which are common in A and B P(B) = Total sales under section B. 1) P( sales of monday given that sales of 2nd week ) = 2730 / 14171 = 0.1926 2) PC sales of sunday given that sales of And week ) = 3468 / 16228 = 0.2137 Similarly we can find for all values, 1. Curve : display curve or trend line over time or day: 4000 3500 3000 2500 2000 1500 1000 500 mm . -Series 0 mon wed fri mon 1 2 3 4 5 6 7 8 9101 $ + * 1 2 2 2 2 4 29262728290 22 Column Chart (hist): 4000 3500 3000 2500 2000 1500 1st week * 2nd week 3rd week 24th week - 5th week 1000 500 mon tue wed thr fri sat sun Conclusion From the graph: 1) Genrally sales are at lowest level at every friday and saturday, 2) Genrally sales are at highest level at every monday and then following by sunday and tuesday. 3) From 2nd chart we can see that, graph is multiodal, hence it is assymetric or Non gaussian or Non normal 4) Hence Given distribution data does not follow Normality or Normal distribution
Step by Step Solution
There are 3 Steps involved in it

Get step-by-step solutions from verified subject matter experts