

Question: please do all. Comparative financial statement data of Sanfield Optical Mart follow: (Click on the icon to view the income statements.) E (Click on the
please do all.
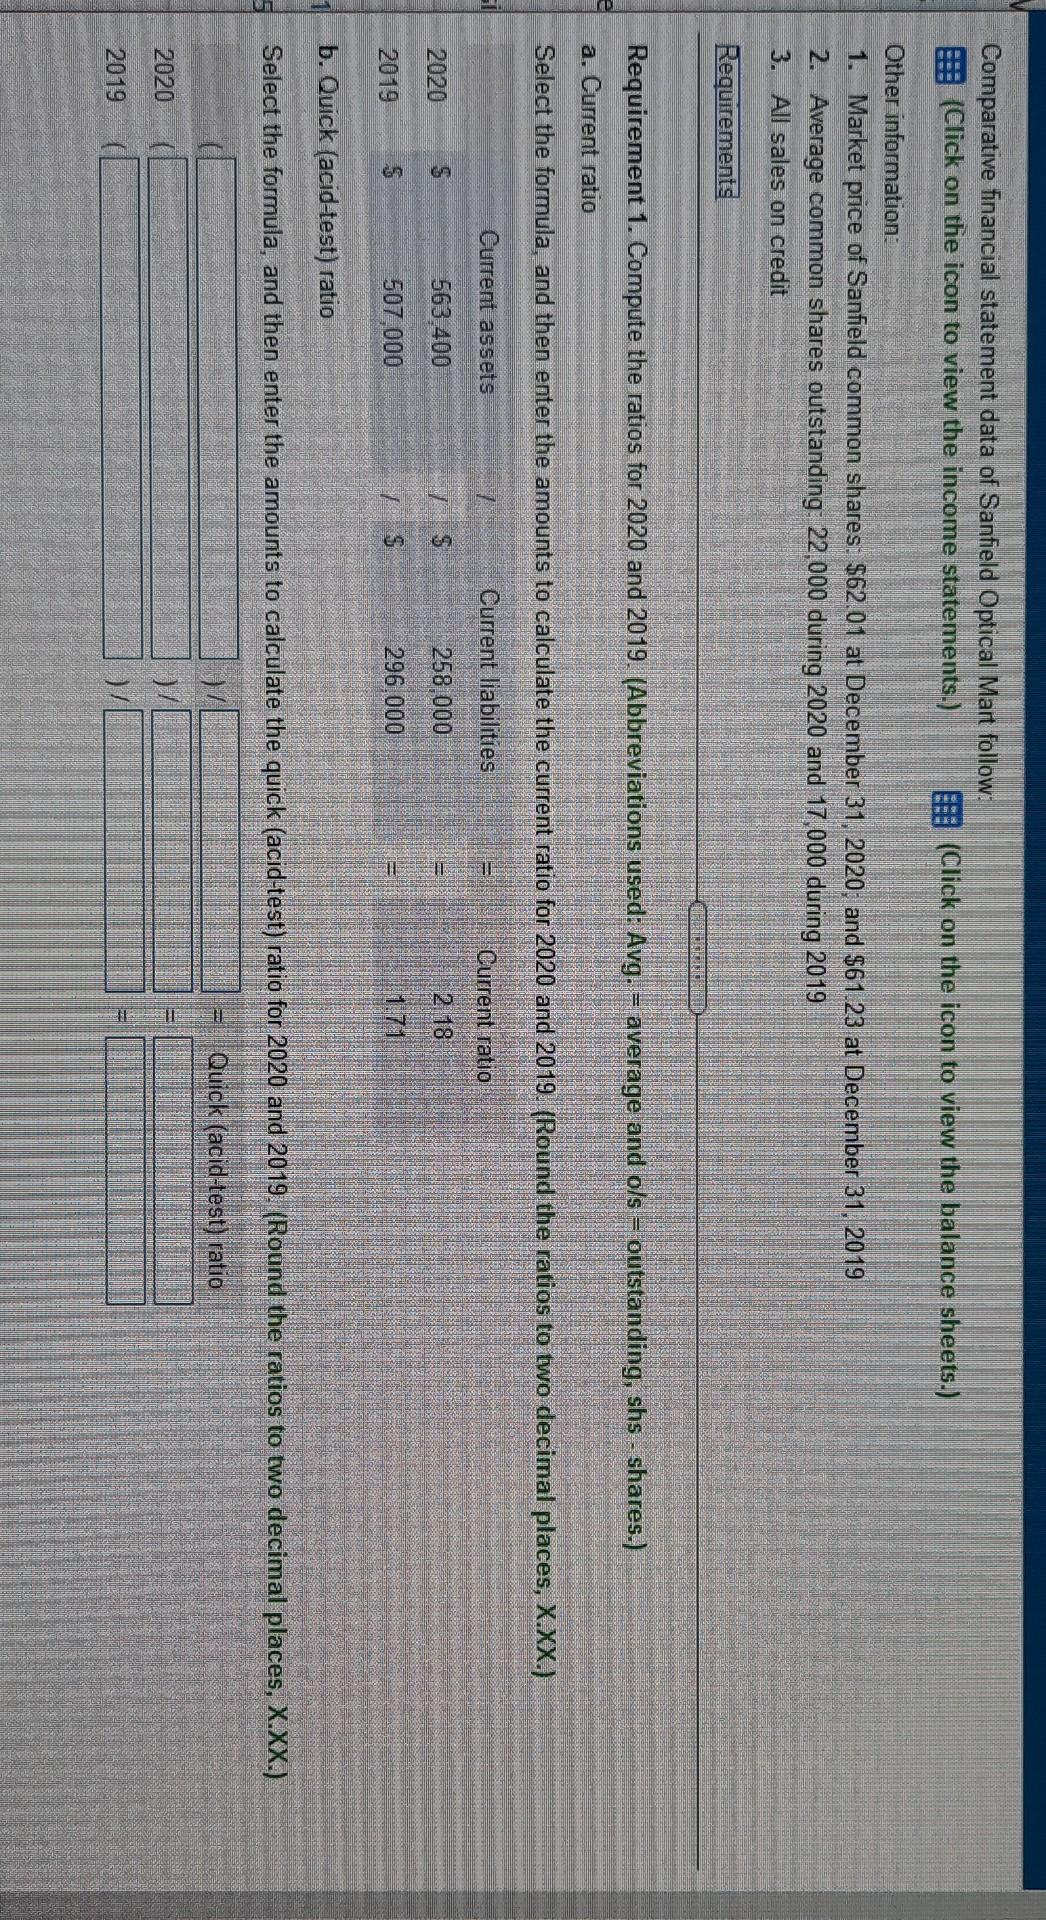
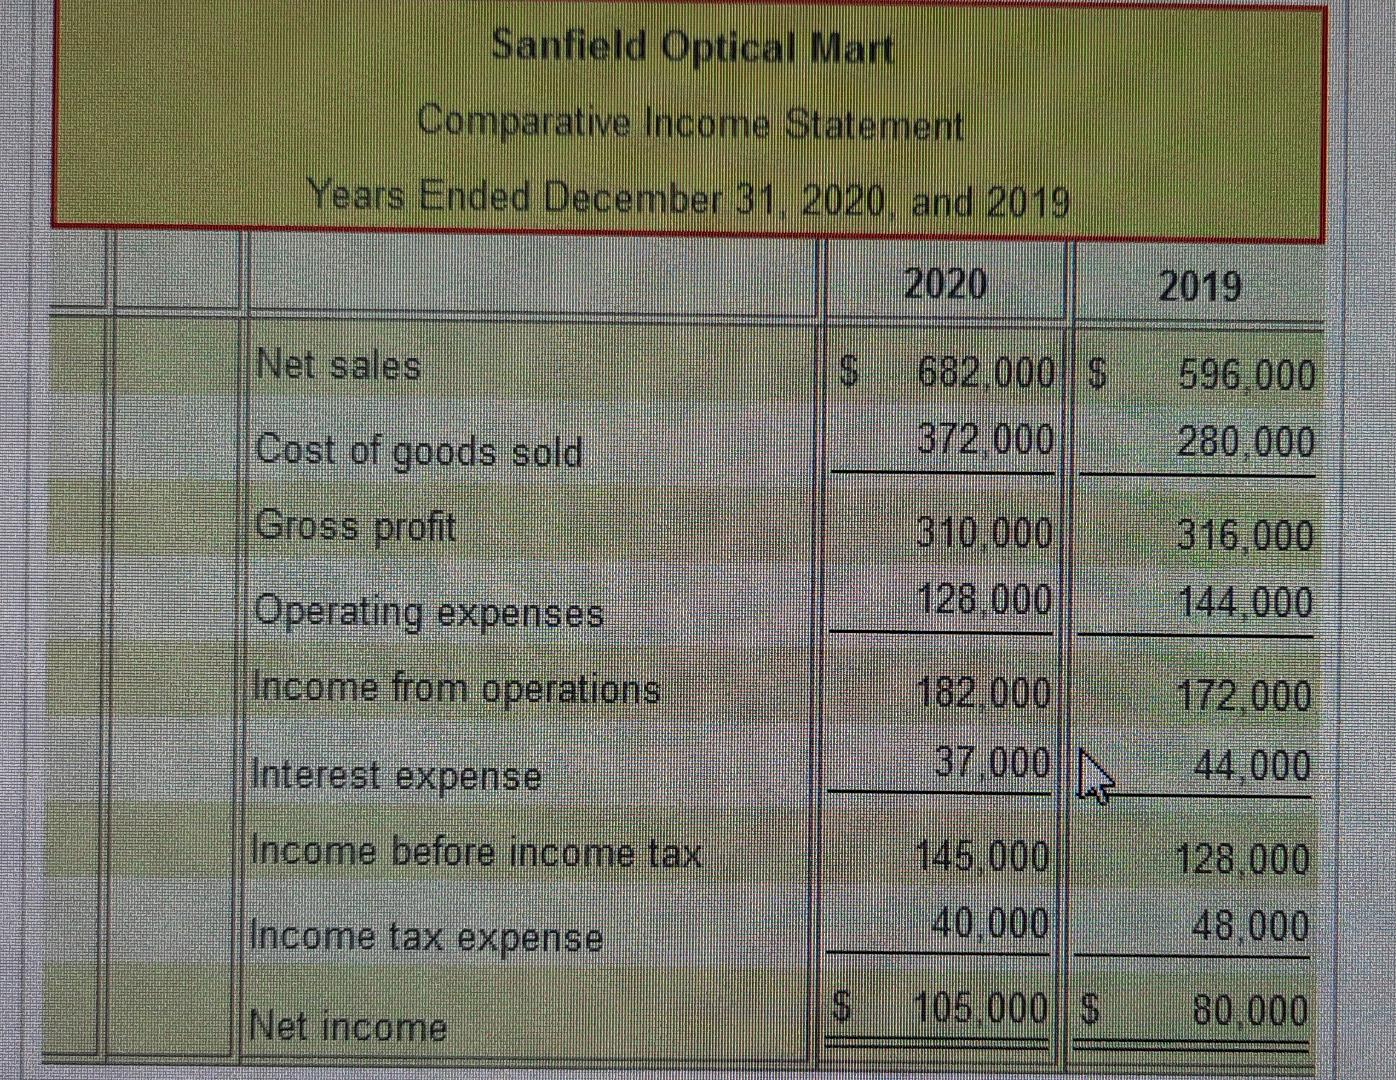
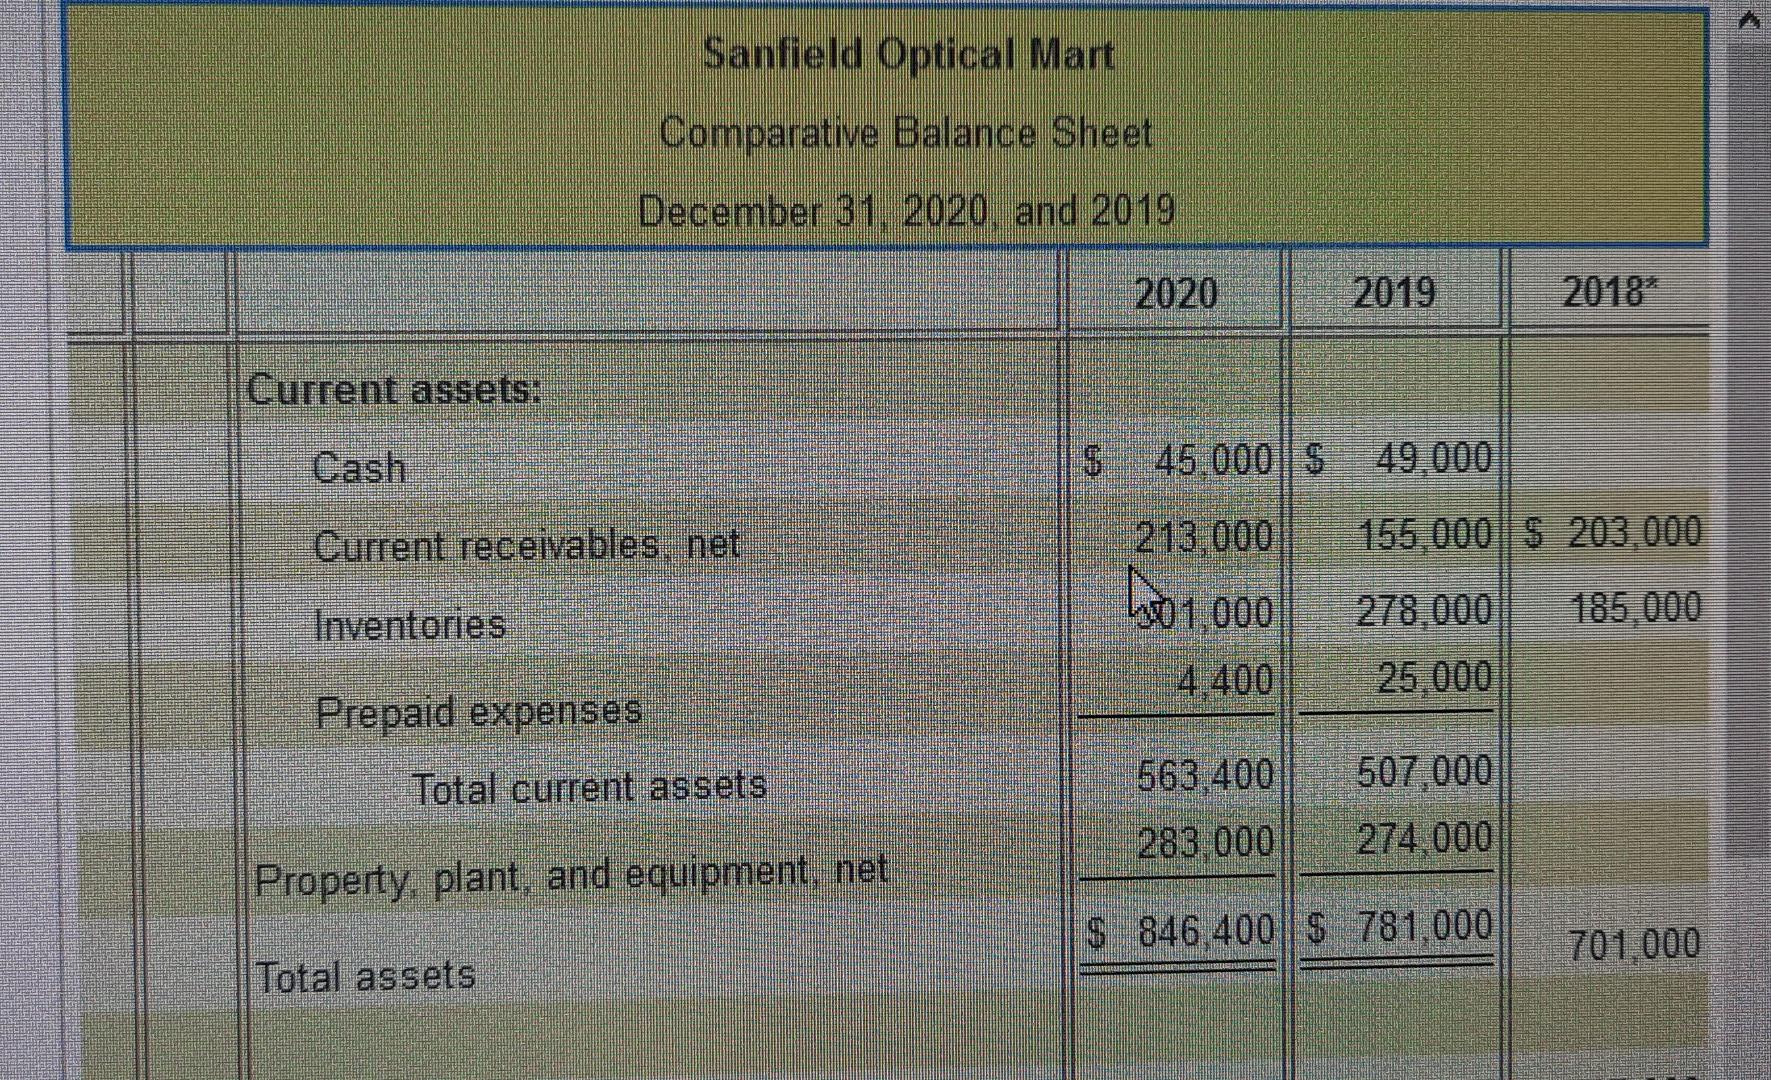
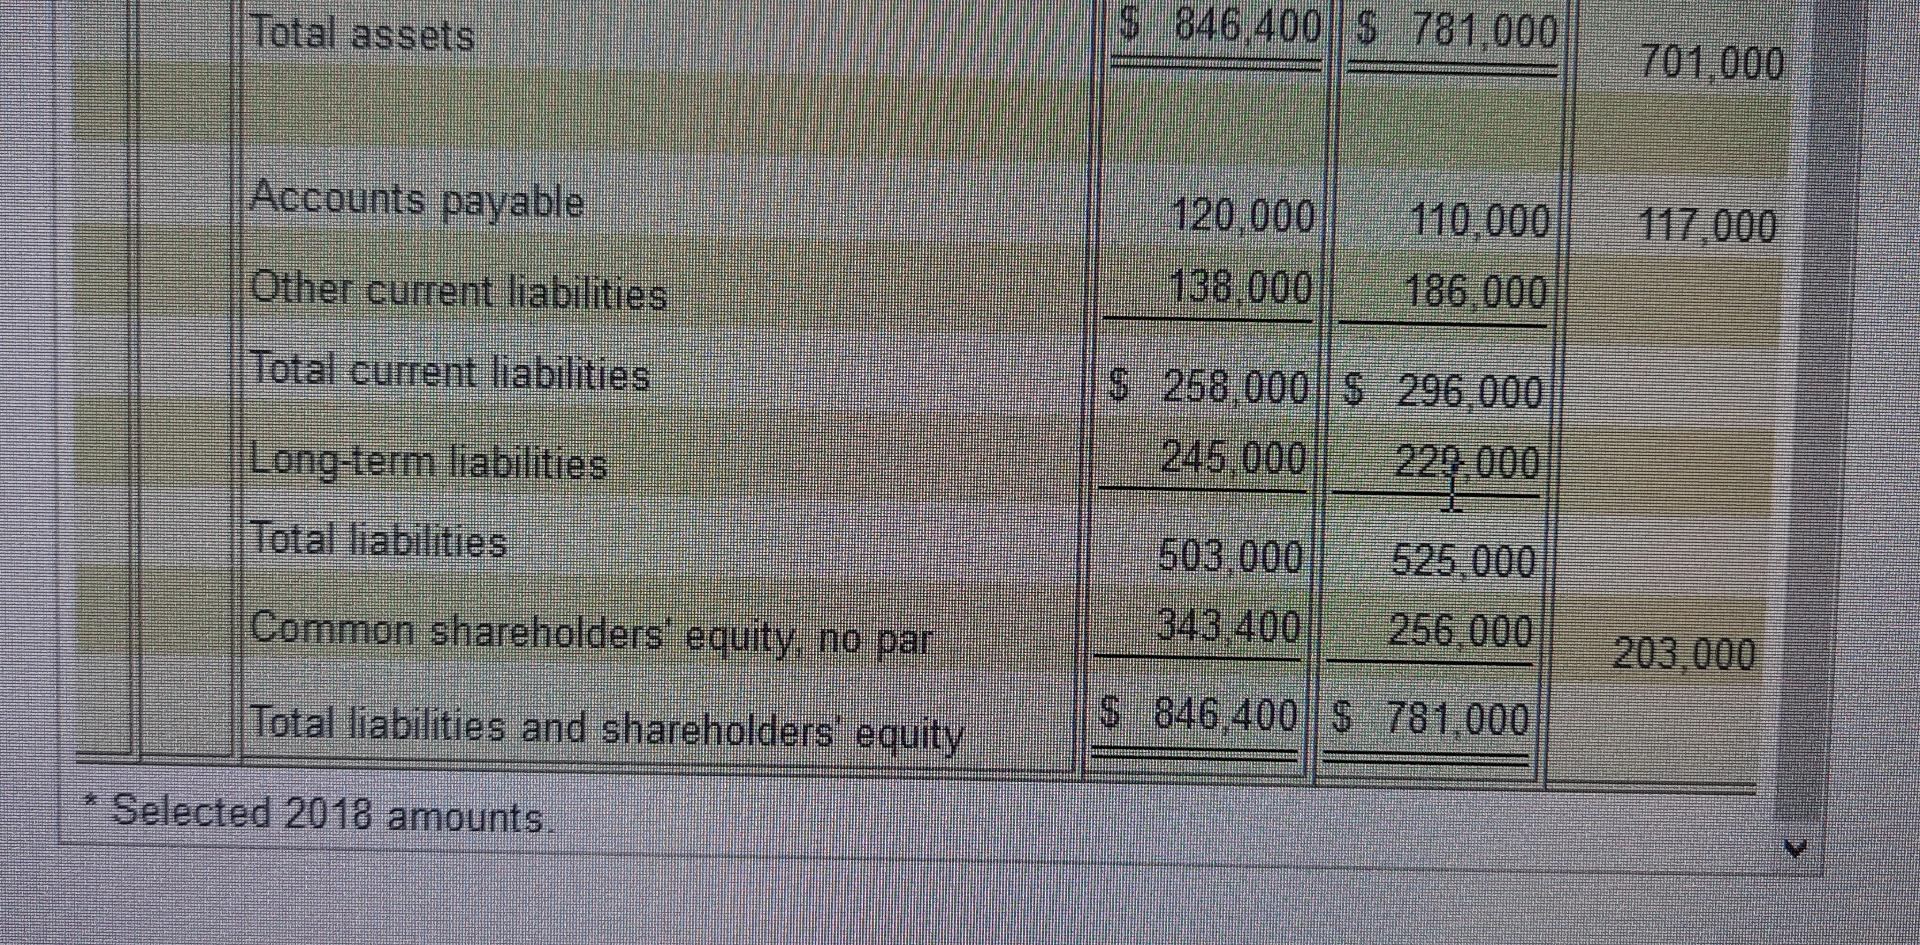
Comparative financial statement data of Sanfield Optical Mart follow: (Click on the icon to view the income statements.) E (Click on the icon to view the balance sheets.) Other information: 1. Market price of Sanfield common shares. $62.01 at December 31, 2020, and $61.23 at December 31, 2019 2. Average common shares outstanding: 22,000 during 2020 and 17,000 during 2019 3. All sales on credit Requirements Requirement 1. Compute the ratios for 2020 and 2019. (Abbreviations used: Avg. average and o/s = outstanding, shs - shares.) a. Current ratio Select the formula, and then enter the amounts to calculate the current ratio for 2020 and 2019. (Round the ratios to two decimal places, X.XX.) Current assets Current liabilities Current ratio 2020 S 09 $ 258 000 2 18 563.400 507,000 2019 S 296.000 b. Quick (acid-test) ratio Select the formula, and then enter the amounts to calculate the quick (acid-test) ratio for 2020 and 2019. (Round the ratios to two decimal places, X.XX.) Quick (acid-test) ratio 2020 ) )/ 2019 Sanfield Optical Mart Comparative Income Statement Years Ended December 31, 2020 and 2019 2020 2019 Net sales 596.000 682.000||$ 372.000 280 000 Cost of goods sold Gross profit 13:10 000 316.000 Operating expenses 128.000 144 000 Income from operations 182.000 172.000 Interest expense 37.000 44.000 LA Income before income tax 145 000 128.000 Income tax expense 40.000 48.000 S. Net income 105.000||$ 80.000 Total assets $ 846,400||$ 781 000 701 000 Accounts payable 120 000 110,000 117.000 Other current liabilities 138.000 186 000 Total current liabilities $ 258,000||$ 296.000 245.000 229.000 Long-term liabilities Total liabilities 503 000 525.000 Common shareholders equity, no par 343 400 256 000 203 000 Total liabilities and shareholders' equity $ 846.400||$ 781.000 Selected 2018 amounts. Requirements 1. Compute the following ratios for 2020 and 2019: a. Current ratio b. Quick (acid-test) ratio c. Receivables turnover and days' sales outstanding (DSO) (round to the nearest whole day) d. Inventory turnover and days' inventory outstanding (DIO) (round to the nearest whole day) e. Accounts payable turnover and days' payable outstanding (DPO) (round to the nearest whole day) f. Cash conversion cycle (in days) g. Times-interest-earned ratio h. Return on assets i. Return on common shareholders' equity j. Earnings per share of common shares g. Price/earnings ratio 2. Decide whether (a) Sanfield's financial position improved or deteriorated during 2020 and (b) the investment attractiveness of Sanfield's common shares appears to have increased or decreased. 3. How will what you learned in this problem help you evaluate an investment
Step by Step Solution
There are 3 Steps involved in it

Get step-by-step solutions from verified subject matter experts