

Question: PLEASE DO ALL PARTS WITH WORK, AND USES R SOFTWARE SO PLEASE SHOW COMMANDS. PLEASE DO QUESTION 2 WHICH STARTS WITH USING THE DATA FROM
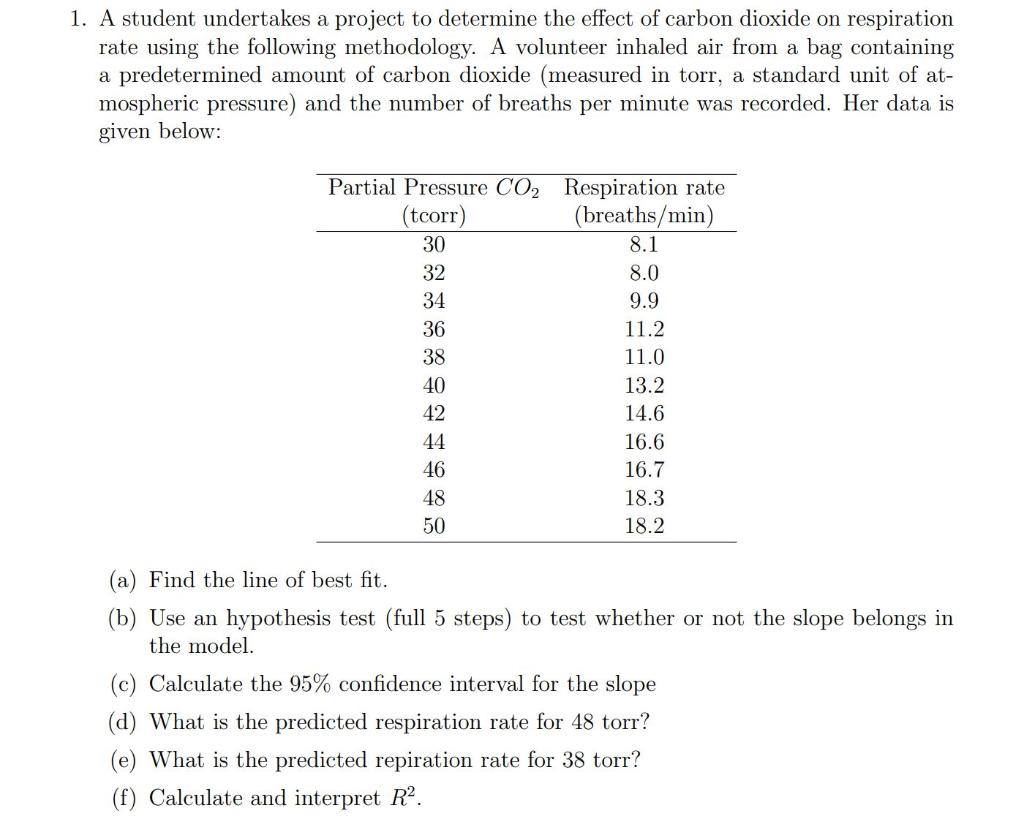
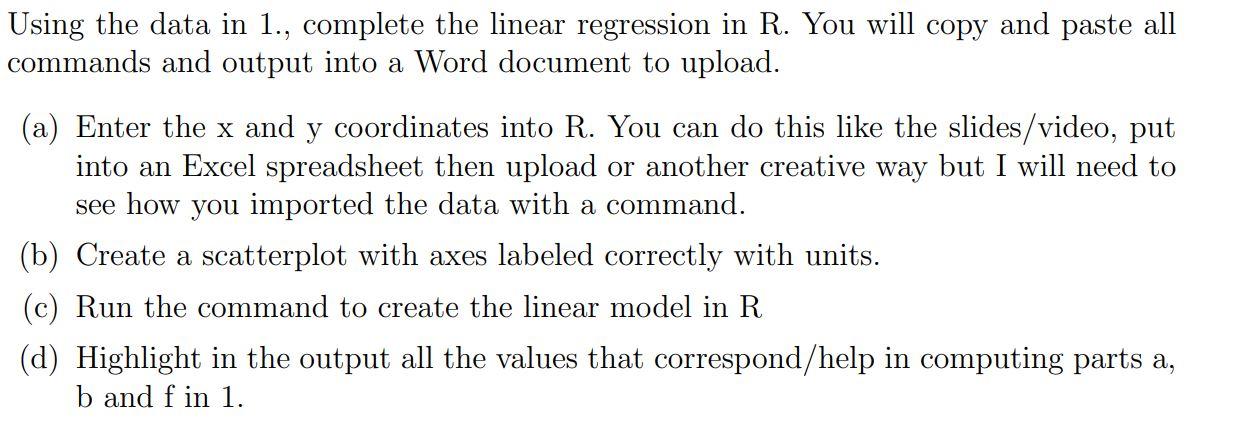 PLEASE DO ALL PARTS WITH WORK, AND USES R SOFTWARE SO PLEASE SHOW COMMANDS. PLEASE DO QUESTION 2 WHICH STARTS WITH "USING THE DATA FROM 1" THE FIRST PICTURE IS ATTACHED FOR THE DATA
Step by Step Solution
There are 3 Steps involved in it
1 Expert Approved Answer
Step: 1 Unlock

Question Has Been Solved by an Expert!
Get step-by-step solutions from verified subject matter experts
Step: 2 Unlock
Step: 3 Unlock