

Question: please do all the requirements Requirements Prepare a graph for fixed manufacturing overhead. The graph should display how Best Around, Inc.'s fixed manufacturing overhead costs
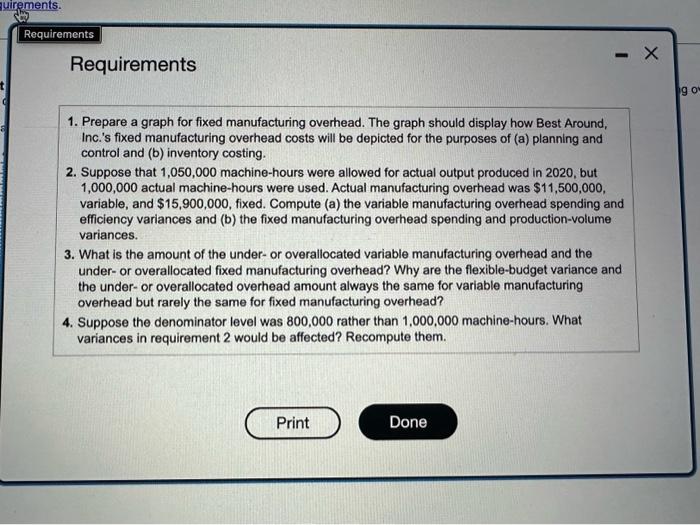
- Prepare a graph for fixed manufacturing overhead. The graph should display how Best Around, Inc.'s fixed manufacturing overhead costs will be depicted for the purposes of (a) planning and control and (b) inventory costing.
- Suppose that 1,050,000 machine-hours were allowed for actual output produced in 2020, but 1,000,000 actual machine-hours were used. Actual manufacturing overhead was $11,500,000, variable, and $15,900,000, fixed. Compute (a) the variable manufacturing overhead spending and efficiency variances and (b) the fixed manufacturing overhead spending and production-volume variances.
- What is the amount of the under- or overallocated variable manufacturing overhead and the under- or overallocated fixed manufacturing overhead? Why are the flexible-budget variance and the under- or overallocated overhead amount always the same for variable manufacturing overhead but rarely the same for fixed manufacturing overhead?
- Suppose the denominator level was 800,000 rather than 1,000,000 machine-hours. What variances in requirement 2 would be affected? Recompute them.
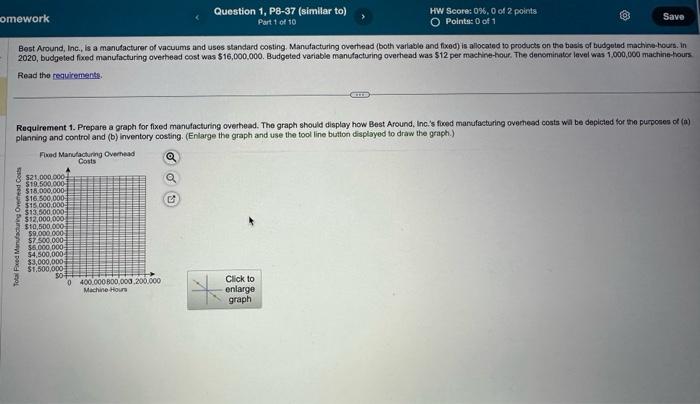
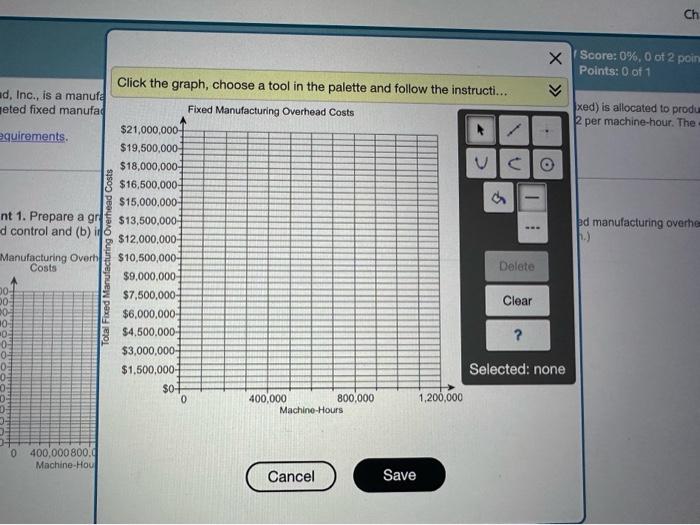
Best Around, Inc., is a manutacturer of vacuums and uses standard costing. Manutacturing overthead (both varlablo and fxod) is alocated to products on the bosis of budgotnd machine-hours. in 2020 , budgeted fixed manufacturing overheed cost was $16,000,000. Budgeted variable manufacturing overhead was $12 per mach ine hour. The deneminatoe level was 1,000,000 machine hours Read the requiremente. Requirement 1. Prepare a graph for fixed manufacturing overhead. The graph should display how Best Around, ino.'s fuxed manufacturing overheod costs wal be depicted for the purposes of (i) plaaning and control and (b) inventory cossing. (Enlarge the graph and use the tool line butlon displayed to draw the graph.) I Score: 0%,0 of 2 poil Points: 0 of 1 id. Inc., is a manut leted fixed manufa xed) is allocated to produ 2 per machine-hour. The aquirements. nt 1. Prepare a gr d control and (b) is Requirements 1. Prepare a graph for fixed manufacturing overhead. The graph should display how Best Around, Inc.'s fixed manufacturing overhead costs will be depicted for the purposes of (a) planning and control and (b) inventory costing. 2. Suppose that 1,050,000 machine-hours were allowed for actual output produced in 2020, but 1,000,000 actual machine-hours were used. Actual manufacturing overhead was $11,500,000, variable, and $15,900,000, fixed. Compute (a) the variable manufacturing overhead spending and efficiency variances and (b) the fixed manufacturing overhead spending and production-volume variances. 3. What is the amount of the under- or overallocated variable manufacturing overhead and the under- or overallocated fixed manufacturing overhead? Why are the flexible-budget variance and the under- or overallocated overhead amount always the same for variable manufacturing overhead but rarely the same for fixed manufacturing overhead? 4. Suppose the denominator level was 800,000 rather than 1,000,000 machine-hours. What variances in requirement 2 would be affected? Recompute them. Best Around, Inc., is a manutacturer of vacuums and uses standard costing. Manutacturing overthead (both varlablo and fxod) is alocated to products on the bosis of budgotnd machine-hours. in 2020 , budgeted fixed manufacturing overheed cost was $16,000,000. Budgeted variable manufacturing overhead was $12 per mach ine hour. The deneminatoe level was 1,000,000 machine hours Read the requiremente. Requirement 1. Prepare a graph for fixed manufacturing overhead. The graph should display how Best Around, ino.'s fuxed manufacturing overheod costs wal be depicted for the purposes of (i) plaaning and control and (b) inventory cossing. (Enlarge the graph and use the tool line butlon displayed to draw the graph.) I Score: 0%,0 of 2 poil Points: 0 of 1 id. Inc., is a manut leted fixed manufa xed) is allocated to produ 2 per machine-hour. The aquirements. nt 1. Prepare a gr d control and (b) is Requirements 1. Prepare a graph for fixed manufacturing overhead. The graph should display how Best Around, Inc.'s fixed manufacturing overhead costs will be depicted for the purposes of (a) planning and control and (b) inventory costing. 2. Suppose that 1,050,000 machine-hours were allowed for actual output produced in 2020, but 1,000,000 actual machine-hours were used. Actual manufacturing overhead was $11,500,000, variable, and $15,900,000, fixed. Compute (a) the variable manufacturing overhead spending and efficiency variances and (b) the fixed manufacturing overhead spending and production-volume variances. 3. What is the amount of the under- or overallocated variable manufacturing overhead and the under- or overallocated fixed manufacturing overhead? Why are the flexible-budget variance and the under- or overallocated overhead amount always the same for variable manufacturing overhead but rarely the same for fixed manufacturing overhead? 4. Suppose the denominator level was 800,000 rather than 1,000,000 machine-hours. What variances in requirement 2 would be affected? Recompute them
Step by Step Solution
There are 3 Steps involved in it

Get step-by-step solutions from verified subject matter experts