

Question: Please do AT LEAST the first two parts: 1) Forecast Fitter Snacker's sales for he next six months 2) Now, create the Sales and Operations
Please do AT LEAST the first two parts:
1) Forecast Fitter Snacker's sales for he next six months
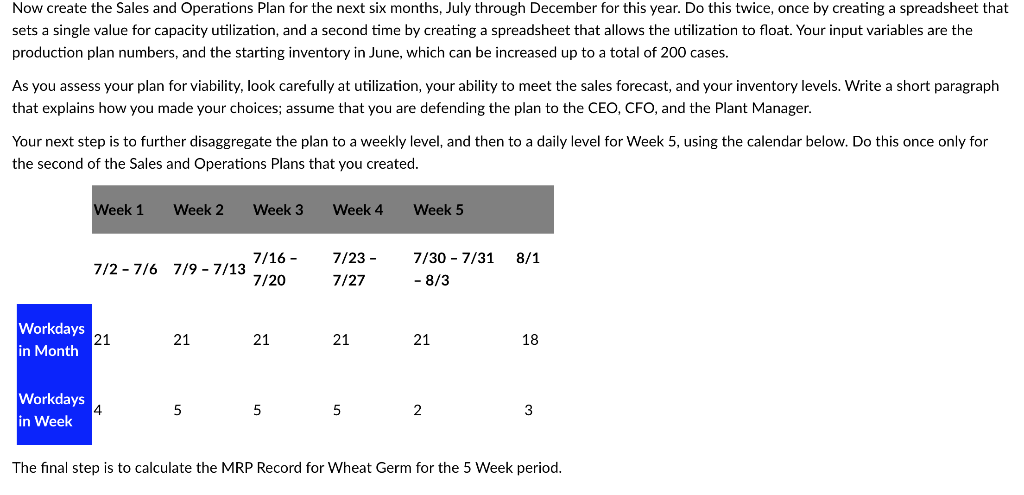
2) Now, create the Sales and Operations Plan for the next six months, July through December for this year. Do this twice, once by creating a spreadsheet that sets a single value for capacity utilization, and a second time by creating a spreadsheet that allows the utilization to float. Your input variables are the production plan numbers, and the starting inventory in June, which can be increased up to a total of 200 cases.
As you assess your plan for viability, look carefully at utilization, your ability to meet the sales forecast, and your inventory levels. Write a short paragraph that explains how you made your choices; assume that you are defending the plan to the CEO, CFO, and the Plant Manager.
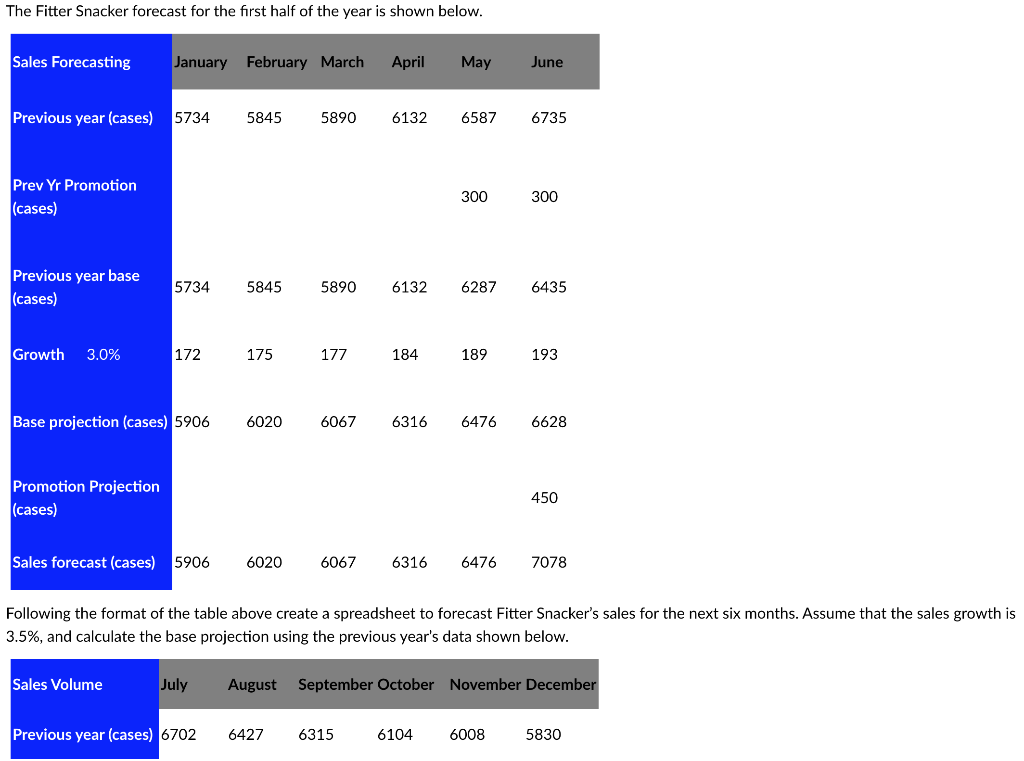
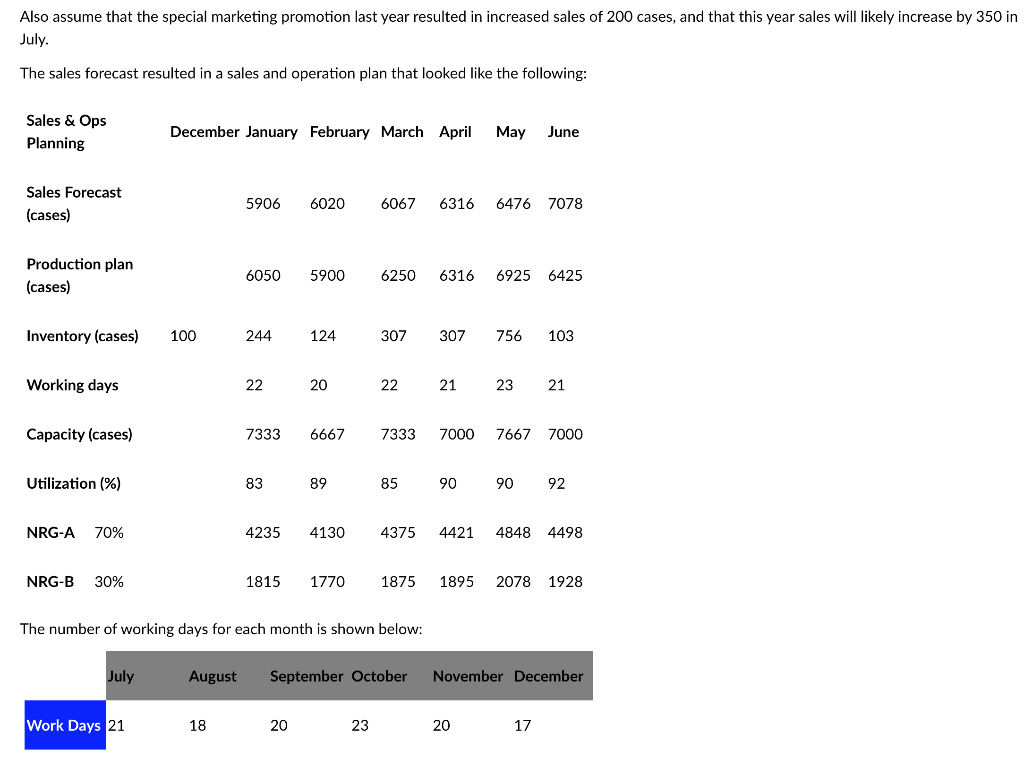
The Fitter Snacker forecast for the first half of the year is shown below. Sales Forecasting January February March April May June Previous year (cases) 5734 5845 5890 6132 6587 6735 Prev Yr Promotion (cases) 300 300 Previous year base (cases) 5734 5845 5890 6132 6287 6435 Growth 3.0% 172 175 177 184 189 193 Base projection (cases) 5906 6020 6067 6316 6476 6628 Promotion Projection (cases) 450 Sales forecast (cases) 5906 6020 6067 6316 6476 7078 Following the format of the table above create a spreadsheet to forecast Fitter Snacker's sales for the next six months. Assume that the sales growth is 3.5%, and calculate the base projection using the previous year's data shown below. Sales Volume July August September October November December Previous year (cases) 6702 6427 6315 6104 6008 5830 Also assume that the special marketing promotion last year resulted in increased sales of 200 cases, and that this year sales will likely increase by 350 in July. The sales forecast resulted in a sales and operation plan that looked like the following: Sales & Ops Planning December January February March April May June Sales Forecast (cases) 5906 6020 6067 6316 6476 7078 Production plan (cases) 6050 5900 6250 6316 6925 6425 Inventory (cases) 100 244 124 307 307 756 103 Working days 22 20 22 21 23 21 Capacity (cases) 7333 6667 7333 7000 7667 7000 Utilization (%) 83 89 85 90 90 92 NRG-A 70% 4235 4130 4375 4421 4848 4498 NRG-B 30% 1815 1770 1875 1895 2078 1928 The number of working days for each month is shown below: July August September October November December Work Days 21 18 20 23 20 17 Now create the Sales and Operations Plan for the next six months, July through December for this year. Do this twice, once by creating a spreadsheet that sets a single value for capacity utilization, and a second time by creating a spreadsheet that allows the utilization to float. Your input variables are the production plan numbers, and the starting inventory in June, which can be increased up to a total of 200 cases. As you assess your plan for viability, look carefully at utilization, your ability to meet the sales forecast, and your inventory levels. Write a short paragraph that explains how you made your choices; assume that you are defending the plan to the CEO, CFO, and the Plant Manager. Your next step is to further disaggregate the plan to a weekly level, and then to a daily level for Week 5, using the calendar below. Do this once only for the second of the Sales and Operations Plans that you created. Week 1 Week 2 Week 3 Week 4 Week 5 7/23 - 8/1 7/2 - 7/6 7/9 - 7/13 7/16 - 7/20 7/30 - 7/31 - 8/3 7/27 Workdays 21 in Month 21 21 21 21 18 Workdays in Week 4 5 5 5 2 3 The final step is to calculate the MRP Record for Wheat Germ for the 5 Week period. The Fitter Snacker forecast for the first half of the year is shown below. Sales Forecasting January February March April May June Previous year (cases) 5734 5845 5890 6132 6587 6735 Prev Yr Promotion (cases) 300 300 Previous year base (cases) 5734 5845 5890 6132 6287 6435 Growth 3.0% 172 175 177 184 189 193 Base projection (cases) 5906 6020 6067 6316 6476 6628 Promotion Projection (cases) 450 Sales forecast (cases) 5906 6020 6067 6316 6476 7078 Following the format of the table above create a spreadsheet to forecast Fitter Snacker's sales for the next six months. Assume that the sales growth is 3.5%, and calculate the base projection using the previous year's data shown below. Sales Volume July August September October November December Previous year (cases) 6702 6427 6315 6104 6008 5830 Also assume that the special marketing promotion last year resulted in increased sales of 200 cases, and that this year sales will likely increase by 350 in July. The sales forecast resulted in a sales and operation plan that looked like the following: Sales & Ops Planning December January February March April May June Sales Forecast (cases) 5906 6020 6067 6316 6476 7078 Production plan (cases) 6050 5900 6250 6316 6925 6425 Inventory (cases) 100 244 124 307 307 756 103 Working days 22 20 22 21 23 21 Capacity (cases) 7333 6667 7333 7000 7667 7000 Utilization (%) 83 89 85 90 90 92 NRG-A 70% 4235 4130 4375 4421 4848 4498 NRG-B 30% 1815 1770 1875 1895 2078 1928 The number of working days for each month is shown below: July August September October November December Work Days 21 18 20 23 20 17 Now create the Sales and Operations Plan for the next six months, July through December for this year. Do this twice, once by creating a spreadsheet that sets a single value for capacity utilization, and a second time by creating a spreadsheet that allows the utilization to float. Your input variables are the production plan numbers, and the starting inventory in June, which can be increased up to a total of 200 cases. As you assess your plan for viability, look carefully at utilization, your ability to meet the sales forecast, and your inventory levels. Write a short paragraph that explains how you made your choices; assume that you are defending the plan to the CEO, CFO, and the Plant Manager. Your next step is to further disaggregate the plan to a weekly level, and then to a daily level for Week 5, using the calendar below. Do this once only for the second of the Sales and Operations Plans that you created. Week 1 Week 2 Week 3 Week 4 Week 5 7/23 - 8/1 7/2 - 7/6 7/9 - 7/13 7/16 - 7/20 7/30 - 7/31 - 8/3 7/27 Workdays 21 in Month 21 21 21 21 18 Workdays in Week 4 5 5 5 2 3 The final step is to calculate the MRP Record for Wheat Germ for the 5 Week periodStep by Step Solution
There are 3 Steps involved in it

Get step-by-step solutions from verified subject matter experts