

Question: Please do* descriptive analysis for the graph below. This graph represent the correlation world happiness score in each feature.Please, do* a least 8 lines or
Please do* descriptive analysis for the graph below. This graph represent the correlation world happiness score in each feature.Please, do* a least 8 lines or more.
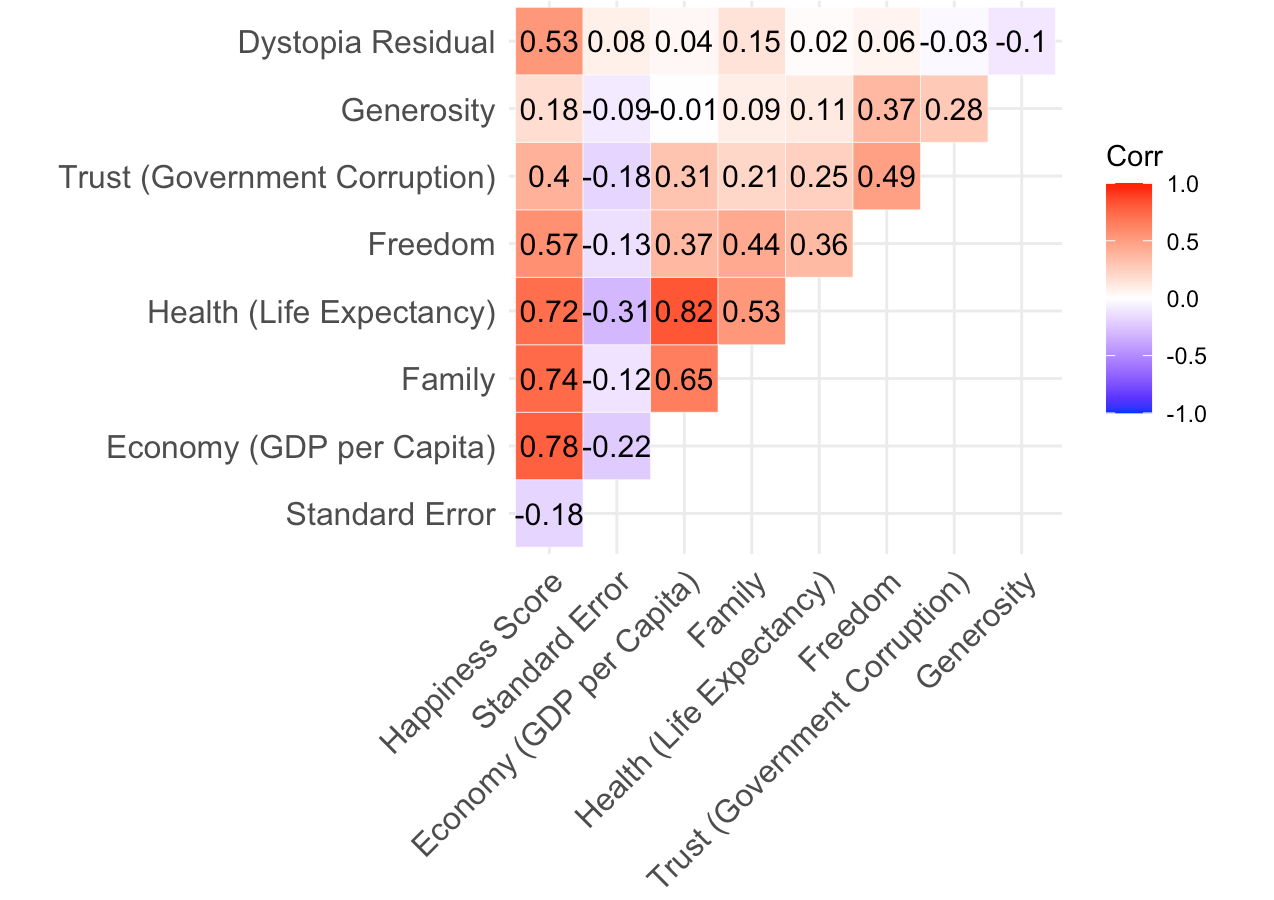
Dystopia Residual 0.53 0.08 0.04 0.15 0.02 0.06-0.03 -0.1 Generosity 0.18-0.09-0.010.09 0. 11 0.37 0.28 Trust (Government Corruption) 0.4 -0.180.31 0.21 0.25 0.49 Corr 1.0 Freedom 0.57-0.130.37 0.44 0.36 0.5 Health (Life Expectancy) 0.72-0.310.82 0.53 0.0 Family 0.74-0.120.65 -0.5 -1.0 Economy (GDP per Capita) 0.78-0.22 Standard Error -0.18 pita) Family Freedom Standard Error Generosity Happiness Score Health (Life Expectancy) Economy (GDP per C Trust (Government Corruption)
Step by Step Solution
There are 3 Steps involved in it

Get step-by-step solutions from verified subject matter experts