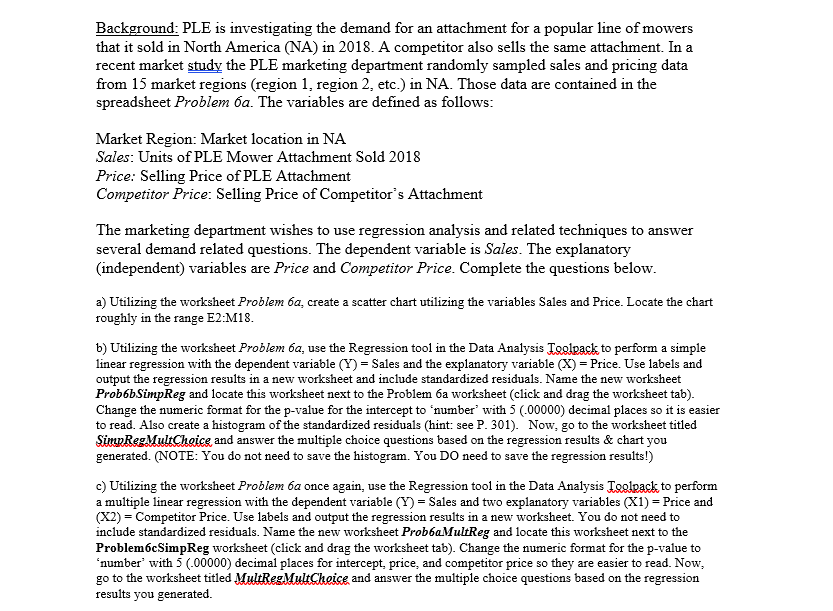
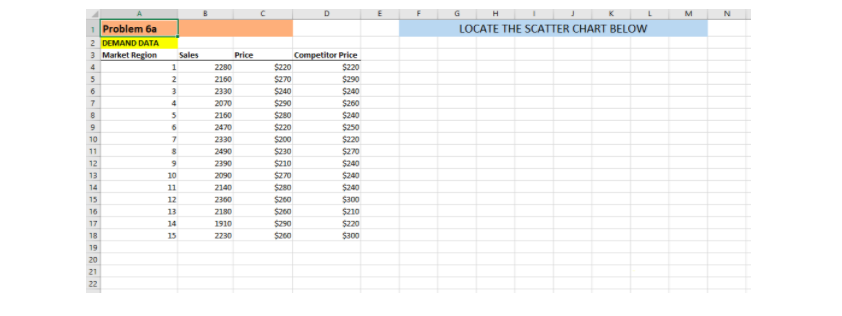
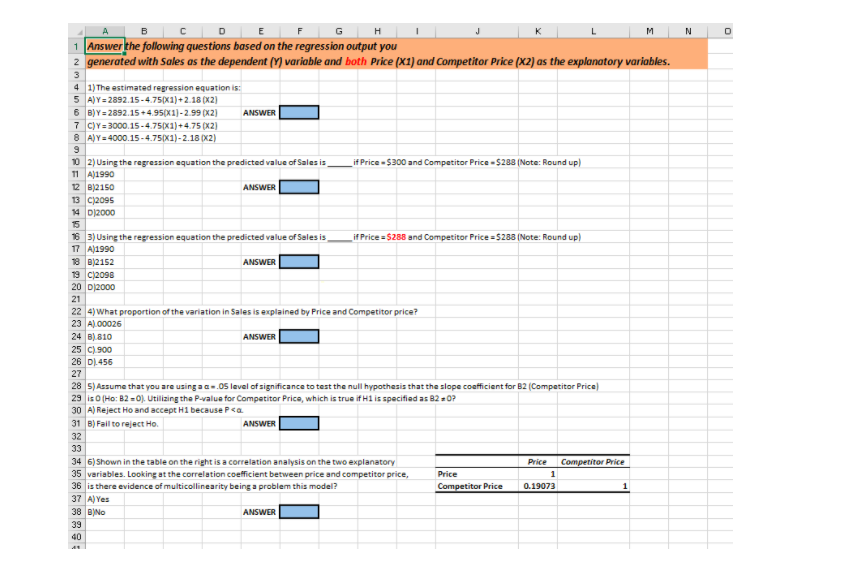
Question: Please do entire questions nad state what was clicked. Background: PLE is investigating the demand for an attachment for a popular line of mowers that

Please do entire questions nad state what was clicked.

Please do entire questions nad state what wasPlease do entire questions nad state what wasPlease do entire questions nad state what was

Background: PLE is investigating the demand for an attachment for a popular line of mowers that it sold in North America (NA) in 2018. A competitor also sells the same attachment. In a recent market study the PLE marketing department randomly sampled sales and pricing data from 15 market regions (region 1, region 2, etc.) in NA. Those data are contained in the spreadsheet Problem 6a. The variables are defined as follows: Market Region: Market location in NA Sales: Units of PLE Mower Attachment Sold 2018 Price: Selling Price of PLE Attachment Competitor Price: Selling Price of Competitor's Attachment The marketing department wishes to use regression analysis and related techniques to answer several demand related questions. The dependent variable is Sales. The explanatory (independent) variables are Price and Competitor Price. Complete the questions below. a) Utilizing the worksheet Problem 6a, create a scatter chart utilizing the variables Sales and Price. Locate the chart roughly in the range E2:M18. b) Utilizing the worksheet Problem ba, use the Regression tool in the Data Analysis Toolpack to perform a simple linear regression with the dependent variable (Y) = Sales and the explanatory variable (X) = Price. Use labels and output the regression results in a new worksheet and include standardized residuals. Name the new worksheet Prob6bSimpReg and locate this worksheet next to the Problem ba worksheet (click and drag the worksheet tab). Change the numeric format for the p-value for the intercept to 'number' with 5 (.00000) decimal places so it is easier to read. Also create a histogram of the standardized residuals (hint: see P. 301). Now, go to the worksheet titled Simp Re: MultChoice and answer the multiple choice questions based on the regression results & chart you generated. (NOTE: You do not need to save the histogram. You Do need to save the regression results!) c) Utilizing the worksheet Problem 6a once again, use the Regression tool in the Data Analysis Tegipack to perform a multiple linear regression with the dependent variable (Y) = Sales and two explanatory variables (x1) = Price and (X2) = Competitor Price. Use labels and output the regression results in a new worksheet. You do not need to include standardized residuals. Name the new worksheet Prob6a MultReg and locate this worksheet next to the Problem 6cSimpReg worksheet (click and drag the worksheet tab). Change the numeric format for the p-value to 'number' with 5 (-00000) decimal places for intercept, price, and competitor price so they are easier to read. Now, go to the worksheet titled MultRegMultChoice and answer the multiple choice questions based on the regression results you generated. D E G H M N LOCATE THE SCATTER CHART BELOW Problem 6a 2 DEMAND DATA 3 Market Region 4 5 7 Price 2290 2160 2330 2070 2160 2470 2330 2490 2390 2090 2140 9 Sales 1 2 3 4 5 6 7 8 9 10 11 12 13 14 15 10 11 Competitor Price $220 $220 $270 $290 $240 $240 $290 $260 $280 $240 $220 $250 $200 $220 $230 $270 $210 $240 $270 $240 $280 $240 $200 $300 $210 $250 $220 $260 $300 2360 2180 12 13 14 15 16 17 18 19 20 21 22 1910 2230 N D B C D E F G H M 1 Answer the following questions based on the regression output you z generated with Sales as the dependent (Y) variable and both Price (X1) and Competitor Price (X2) as the explanatory variables. 3 4 1) The estimated regression equation is: 5 A)Y=2892.15-4.75(X1)+2.18 (X2) 6 B)Y=2892.15 +4.95(X1)-2.99 (x2) ANSWER 7 C)Y= 3000.15-4.75(X1)+4.75(X2) 8 A)Y=4000.15-4.75(X1)-2.18 (X2) 9 102) Using the regression equation the predicted value of Sales is if Price $300 and Competitor Price $288 (Note: Round up) 11 A 1990 12 B2150 ANSWER 13 C2095 14 012000 16 16 3) Using the regression equation the predicted value of Sales is if Price = $288 and Competitor Price =5288 (Note: Round up) 17 A 1990 18 02152 ANSWER 19 C2098 20 D 2000 21 224) What proportion of the variation in Sales is explained by Price and Competitor price? 23 A00026 24 B) 810 ANSWER 25 C) 900 26 D.456 27 28 5) Assume that you are using a c..05 level of significance to test the null hypothesis that the slope coefficient for B2 Competitor Price 29 is o [Ho: B2 -0). Utilizing the P-value for Compatitor Price, which is true if H1 is specified as B2:0P 30 A) Reject Ho and accept H1 because P

Step by Step Solution

There are 3 Steps involved in it

1 Expert Approved Answer
Step: 1 Unlock blur-text-image
Question Has Been Solved by an Expert!

Get step-by-step solutions from verified subject matter experts

Step: 2 Unlock
Step: 3 Unlock

Students Have Also Explored These Related General Management Questions!