

Question: please do in matlab For the data in the following table, the y data obviously decays as x increases: Fit this data to a curve
please do in matlab
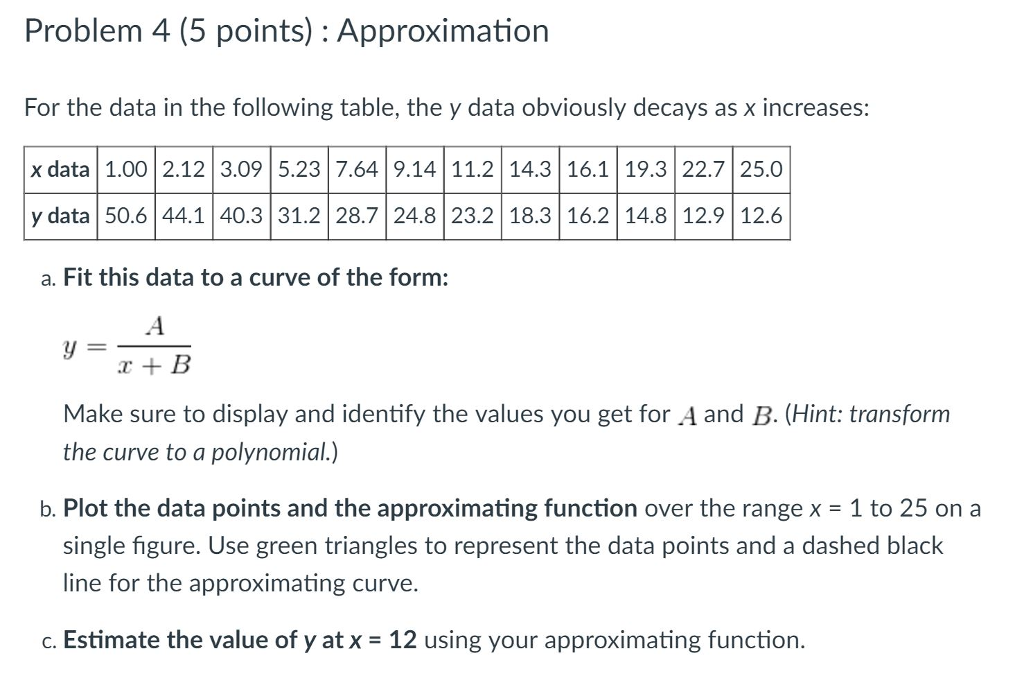
For the data in the following table, the y data obviously decays as x increases: Fit this data to a curve of the form: y = A/x + B Make sure to display and identify the values you get for A and B. Plot the data points and the approximating function over the range x = 1 to 25 on a single figure. Use green triangles to represent the data points and a dashed black line for the approximating curve. Estimate the value of y at x = 12 using your approximating function
Step by Step Solution
There are 3 Steps involved in it
1 Expert Approved Answer
Step: 1 Unlock

Question Has Been Solved by an Expert!
Get step-by-step solutions from verified subject matter experts
Step: 2 Unlock
Step: 3 Unlock