

Question: please do it fast and dont copy from previous answers, thank you and explaining please please finish asap, need the appropriate commands. this should be
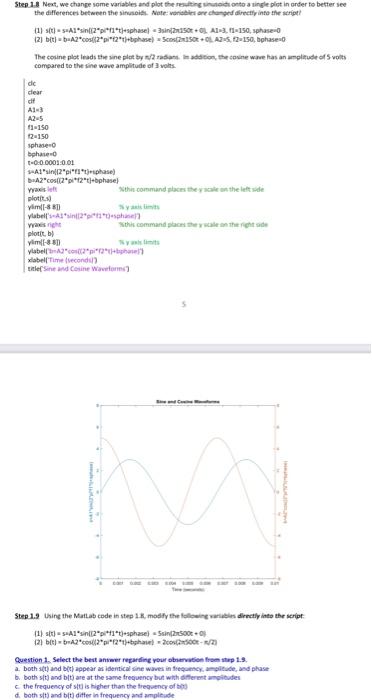
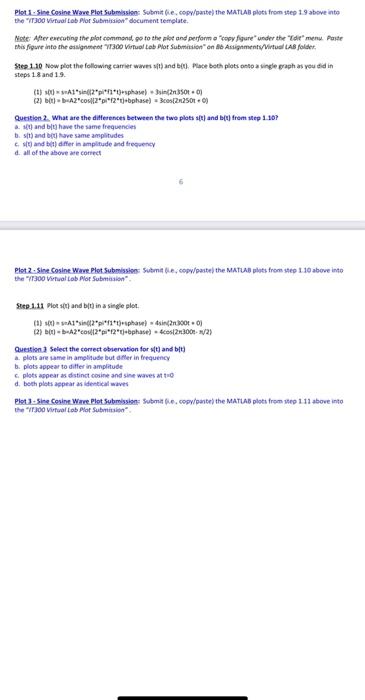
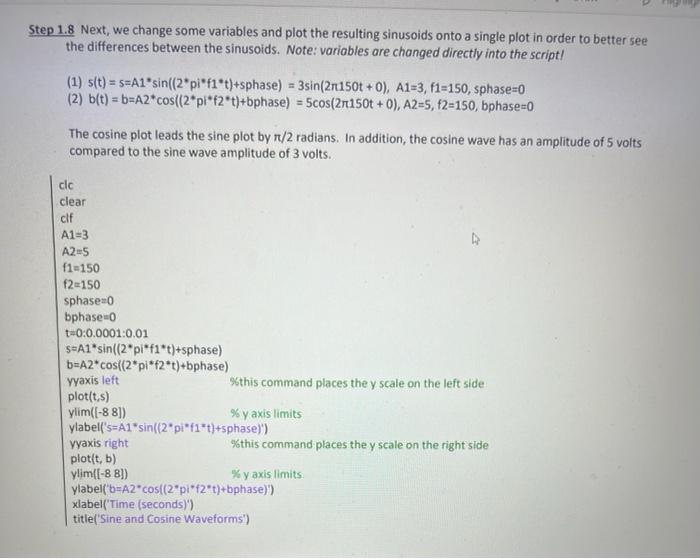
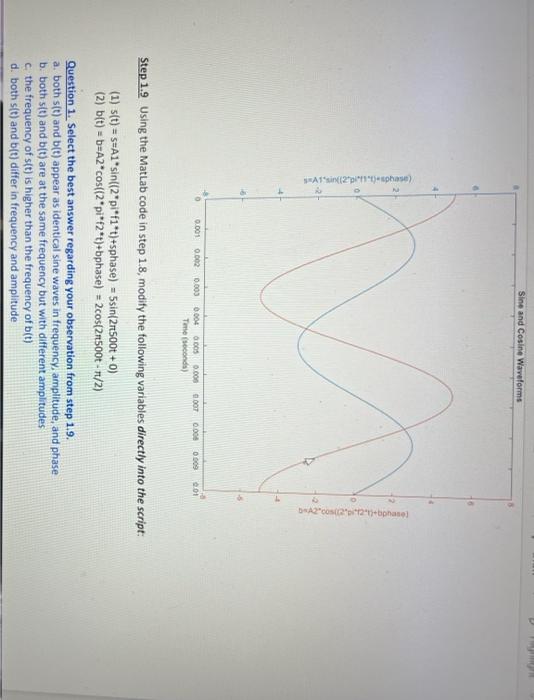
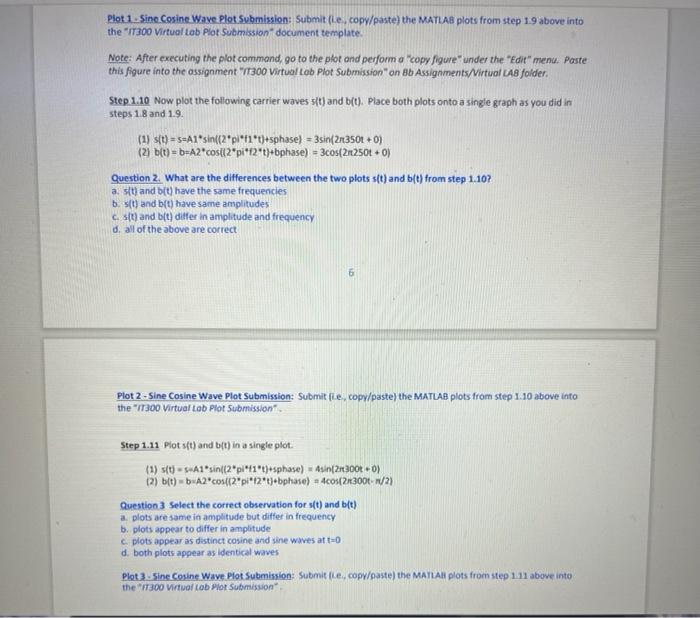
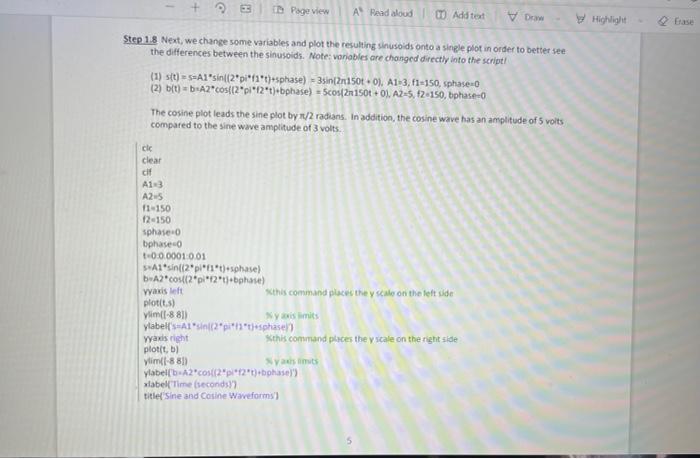
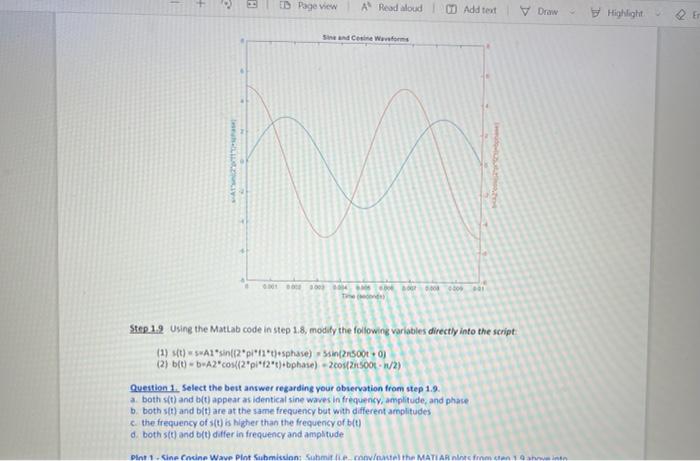
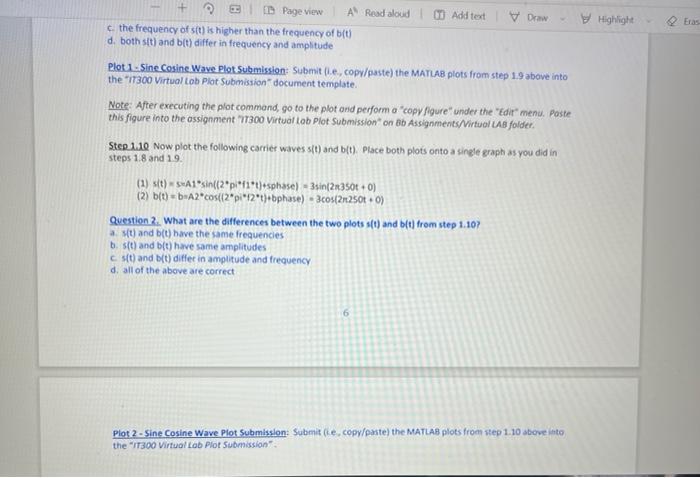
Step 1.58 Weot, we change some variables and plot the reutitg unstodt onto a lingle plot in onder to better see the differencei between the sirusoiat. Aote: vendeles ane changed directif inte the scrigt? The covine plot leads the sine plet by m/2 radans. In additon, the coune ware has an amplifude of 5 volts compared to the ine wave amplitude of 3 vehs. Step 1.2 Whint the Maflab code in step 1 is, mosty the lellowine wariblis dirnatly inte the seript: Question 1. Sefect the bet antieer recarding revir obnerubion from itrep 1.8. a. both att) and b(t) appear as identical aine waves in fiequency, an pleude, and plase b. both s s(t) and b(t) are at the same frequency but whth dfferent anpitibien c. the frequency of s/t is higher than the trequency of bod d. both s(t) and biti ditter in frequency and ampieude Plot. I. Sine Cosine Ware Piot Submissions Sabmit (ie. copv/parte) the MatLAb ploti frem itep 1.9 above into the "ir3oo virtual tob Fior Submisiow" document temelate. Niste; After erecubing the plot commsnt, go to the plot and perform o "copy figure" under the "Ide" meny. Falte Stes 1.10 Now plot the following carrier wavet sit) and bect. Face beth plots onso a vingle graph ar veu did in steps 1.8 and 1.9. (t) s(d) = in A1s((12p(+11+t)+sphave)+3sin(2r3s0t+0) (2) b(d)= be A2cos(2pi(2t)+bphase)=3cos(2n250t+) Queitien.2. What are the differences between the two plati ste) and b(t) frem 1 tep 1 ib? a. s(i) and b(t) have the same frequencies b. s(t) and b(r) Aure same amplitudes c. s(t) and b(l) d fter in amplifude and fresuency d. all of the above are corrict. Plot 2. Sine Cosine Ware Plot Submissions: Suhma (1.e; copw/paste) the MATUAl plots from step 1.10 above into the "i 300 virtival Lab Plof Submasion". Sep.1.11 Flot s(t) and b(t) in a siege plot. (A) set = znA. "sin(t2"pi+41+1)+iphavel =4 sin(2n 300t+0) Queation.1 Select the cortect observation for M(t] ans b b t] a. plots are same in amplitude but dMer in trequency b. plots appear to differ in amplitude c. plots appear as distinct cosine and sine waves at tu 0 d. beth plets aspear as ifentical waves Plet 3 + Sine Cesine Ware Plot Submission; Subma (.e., copy/panted the MaTLA. ploti from wep 1.11 above into the "if Jod vistual tob Plof Submitaion". tep 1.8 Next, we change some variables and plot the resulting sinusoids onto a single plot in order to better see the differences between the sinusoids. Note: variables are changed directly into the script/ (1) s(t)=s=A1sin((2pif1t)+sphase)=3sin(2150t+0),A1=3,f1=150, sphase =0 (2) b(t)=b=A2cos((2pif2t)+bphase)=5cos(2150t+0),A2=5,f2=150, bhase =0 The cosine plot leads the sine plot by /2 radians. In addition, the cosine wave has an amplitude of 5 volts compared to the sine wave amplitude of 3 volts. Step 1.9 Using the MatLab code in step 1.8, modify the following variables directly into the script: (1) s(t)=s=A1sin((2pif1t)+sphase)=5sin(2500t+0) (2) b(t)=b=A2cos((2pif2t)+bphase)=2cos(2500t/2) Question 1. Select the best answer regarding your observation from step 1.9. a. both s(t) and b(t) appear as identical sine waves in frequency, amplitude, and phase b. both s(t) and b(t) are at the same frequency but with different amplitudes c. the frequency of s(t) is higher than the frequency of b(t) d. both s(t) and b(t) differ in frequency and amplitude Plot 1- Sino Cosine Wave Plot Submission: Submit (Le, copy/paste) the MATLAs plots from step 1.9 above into the "rr300 Virtual tab Plot Submission" document template. Note: After executing the plot command, go to the plot and perform a "copy figure" under the "Edit" menu. Paste this figure into the assignment "IISOo Virtual tob Plot Submission" on Bb Assignments/Virtual LAB folder. Step 1.10 Now plot the following carrier waves sit) and b(t). Place both plots onto a single graph as you did in steps 1.8 and 1.9. (1) s(t)=s=A1sin((2pi+1t)+sphase)=3sin(2350t+0) (2) b(t)=b=A2cos(2pi+12t)+bphase)=3cos(2250t+0) Question 2. What are the differences between the two plots s(t) and b(t) from step 1.10? a. s(t) and b(t) have the same frequencies b. s(t) and b(t) have same amplitudes c. s(t) and b(t) ditfer in amplitude and frequency d. all of the above are correct Plot 2 - Sine Cosine Wave Plot Submission: Submit (i.e, copy/paste) the MATLAB plots from step 1.10 above into the "II30o Virtual tob Plot Submission". Step 1.11 Plot s s (t) and b(t) in a single plot. (1) sin(t)=sinAsin((2pi+1t)+shase)=4sin(2300t+0) (2) b(t)=b=A2cos((2pi12t)+bphave)=4cos(2300t/2) Question 3 Select the correct observation for s(t) and b(t) a. plots are same in amplitude but differ in frequency b. plots appear to differ in amplitude c. plots appear as distinct cosine and sine waves at t=0 d. both plots appear as identical waves Plot 3 - Sine Cosine Wave Plot Submistion: Submit (Le, copv/paste) the MAnLAll plots from step 1.11 above into. the "If 300 Virtual Lab Hlor Submisuion". Step 1.8. Next, wechange some variables and plot the resulting sinusoids onto a single plot in order to better see the differences between the sinusoids. Note: voriables are chonged directly into the script! (2) b(t)=b=A2cos((2pi(2t)+bhase)=5cos(2150t+0),A2=5,+2=150, bphase =0 The cosine plot leads the sine plot by /2 radians. In addition, the cosine ware has an amplitude of 5 volts compared to the sine wave amplitude of 3 volts. Step.1.9 Using the Mattab code in step 1:8, modily the following variables directly into the script: (1) s(t)=sinA1sin(2pi+1t)+sphase)=sin(2sin00t+0) (2) b(t)=b=A2cos((2it2t)+bphase)=2cos(2ns00rn/2) Queution 1. Select the beut answer regarding your obiervation from step 1.9. a. both s(t) and b(t) appear as identical sine wares in frequency, ampilitude, and phase b. both s (t) and b(t) are at the same frequency but with different amplitudes c. the frequency of s(t) is higher than the frequency of b(t) d. both s (t) and b(t) differ in frequency and ampltude c. the frequency of s(t) is higher than the frequency of b(t) d. both sit) and b(t) differ in frequency and amplitude Plot 1. Sine Cosine Wave Plot Submission: Submit (i.e, copy/paste) the MATLAB plots from step 1.9 above into the "It300 Virtuol Lob Plot Submission" document template. Note: After executing the plot command, go to the plot and perform a "copy figure" under the "Eir" menu. Poste this figure into the assignment "1300 Virtuat Lab Plot Submission" on 66 Assignments/Virtuol LAe folder. Sten 1.1Q Now plot the following carrier waves s(t) and b(t). Place both plots onto a single graph as you did in steps 1.8 and 1.9. (1) s(t)=sec1sin((2p0t1t)+sphase)=3sin(2350t+0) (2) b(t)=b=A2cos((2pi12t)+bphase)=3cos(2250t+0) Question 2 . What are the differences between the two plots s (t) and b(t) frem step 1.10 ? a. s(t) and b(t) bave the same frequencies b. s(t) and b(t) have same amplitudes c. sit) and b(t) differ in amplitude and frequency d. all of the above are correct 6 Piot 2 - Sine Cosine Wave Plot Submisslon: Submit (Le, copy/pate) the MATLAB plots from tep 1.10 above into the "irsoo virtual Lab Plot Submission". Question 2. What are the differences between the two plots s(t) and b(t) from step 1.10? a. s(t) and b(t) have the same frequencies b. s(t) and bit) have same amplitudes c. s(t) and b(t) differ in amplitude and frequency d. all of the above are correct 6 Plot 2 - Sine Cosine Wave Plot Submission: Submit (i.e., copy/paste) the MATLAB plots from step 1.10 above into the "I1300 Virtual tob Plot Submission". Step 1.11. Plot s(t) and b(t) in a single plot. (1) s(t)=seAlsin{(2pif1t)+5phase)=4sin(2300t+0) (2) b(t)=b=A2cos((2pif2t)+bphase)=4cos(2n300t1/2) Question. 3 Select the correct observation for s(t) and b(t) a. plots are same in amplitude but differ in frequency b. plots appear to differ in amplitude c. plots appear as distinct cosine and sine waves at t=0 d. both plots appear as identical waves Plot 3 - Sine Cosine Wave Plot Submission: Submit (Le., copy/paste) the MATLAl plots from step 1.11 above into the "Irsoo Virtuat Lab Plor Submission
Step by Step Solution
There are 3 Steps involved in it

Get step-by-step solutions from verified subject matter experts