

Question: please do it in 10 minutes will upvote The table below gives the growth statistics for the USA in the last 15 years. Growth Rate
please do it in 10 minutes will upvote
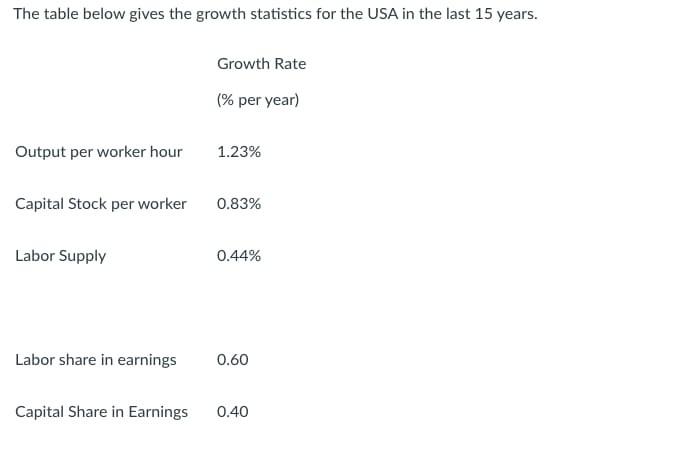
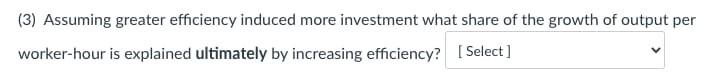
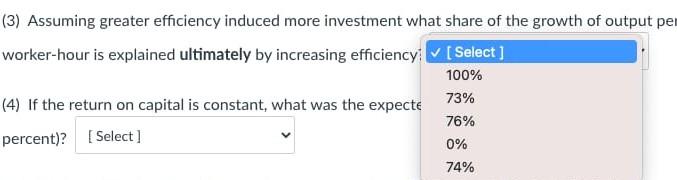
The table below gives the growth statistics for the USA in the last 15 years. Growth Rate (% per year) Output per worker hour 1.23% Capital Stock per worker 0.83% Labor Supply 0.44% Labor share in earnings 0.60 Capital Share in Earnings 0.40 (3) Assuming greater efficiency induced more investment what share of the growth of output per worker-hour is explained ultimately by increasing efficiency? [Select] (3) Assuming greater efficiency induced more investment what share of the growth of output pe worker-hour is explained ultimately by increasing efficiencySelect ] 100% (4) If the return on capital is constant, what was the expecte 73% 76% percent)? [Select] 0% 74% The table below gives the growth statistics for the USA in the last 15 years. Growth Rate (% per year) Output per worker hour 1.23% Capital Stock per worker 0.83% Labor Supply 0.44% Labor share in earnings 0.60 Capital Share in Earnings 0.40 (3) Assuming greater efficiency induced more investment what share of the growth of output per worker-hour is explained ultimately by increasing efficiency? [Select] (3) Assuming greater efficiency induced more investment what share of the growth of output pe worker-hour is explained ultimately by increasing efficiencySelect ] 100% (4) If the return on capital is constant, what was the expecte 73% 76% percent)? [Select] 0% 74%
Step by Step Solution
There are 3 Steps involved in it

Get step-by-step solutions from verified subject matter experts