

Question: PLEASE DO IT IN EXCEL AND HOW YOU DID IT 1.1 Given the following two stocks X and Y Stock X Y Forecast return 8.5%
PLEASE DO IT IN EXCEL AND HOW YOU DID IT
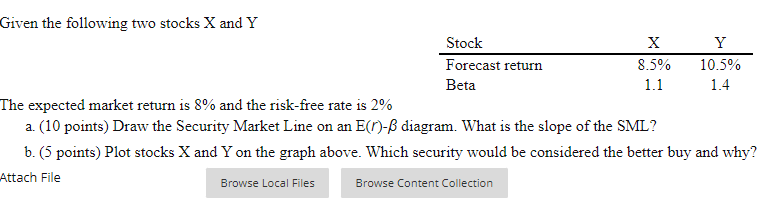
1.1 Given the following two stocks X and Y Stock X Y Forecast return 8.5% 10.5% Beta 1.4 The expected market return is 8% and the risk-free rate is 2% a. (10 points) Draw the Security Market Line on an E(1-B diagram. What is the slope of the SML? b. (5 points) Plot stocks X and Y on the graph above. Which security would be considered the better buy and why? Attach File Browse Local Files Browse Content Collection
Step by Step Solution
There are 3 Steps involved in it
1 Expert Approved Answer
Step: 1 Unlock

Question Has Been Solved by an Expert!
Get step-by-step solutions from verified subject matter experts
Step: 2 Unlock
Step: 3 Unlock