

Question: please do it in excel with The equations shown and specify what colmns used fir which chart 3. Whole Grains LLC uses statistical process control
please do it in excel with The equations shown and specify what colmns used fir which chart
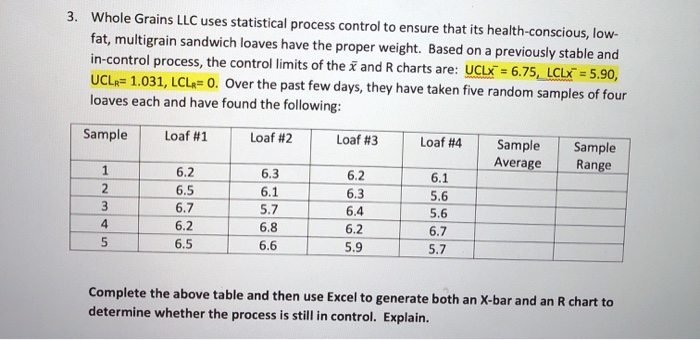
3. Whole Grains LLC uses statistical process control to ensure that its health-conscious, low- fat, multigrain sandwich loaves have the proper weight. Based on a previously stable and in-control process, the control limits of the x and R charts are: UCLX = 6.75, LCLX = 5.90, UCL = 1.031, LCLR0. Over the past few days, they have taken five random samples of four loaves each and have found the following: Sample Loaf #1 Loaf #2 Loaf #3 Loaf #4 Sample Average Sample Range 6.2 6.5 6.1 5.6 6.3 6.1 5.7 6.8 6.6 6.2 6.3 6.4 6.2 5.9 6.5 5.7 Complete the above table and then use Excel to generate both an X-bar and an R chart to determine whether the process is still in control. Explain Step by Step Solution
There are 3 Steps involved in it
1 Expert Approved Answer
Step: 1 Unlock

Question Has Been Solved by an Expert!
Get step-by-step solutions from verified subject matter experts
Step: 2 Unlock
Step: 3 Unlock