

Question: Please do it in matlab Consider the curve traced out by the set of parametric equations: over the domain . The curve is shown in
Please do it in matlab
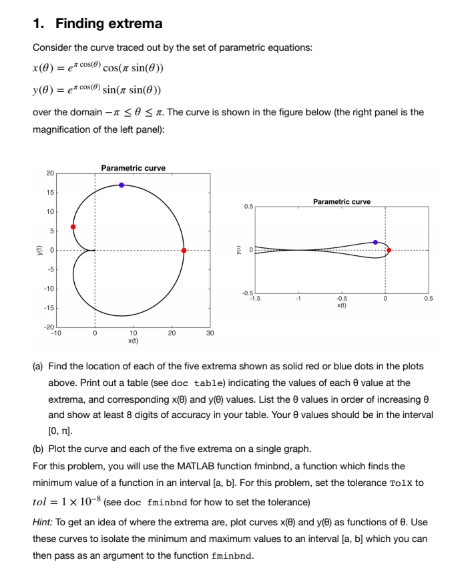
Consider the curve traced out by the set of parametric equations:
over the domain . The curve is shown in the figure below (the right panel is the magnification of the left panel):
(a) Find the location of each of the five extrema shown as solid red or blue dots in the plots above. Print out a table (see doc table) indicating the values of each value at the extrema, and corresponding x() and y() values. List the values in order of increasing and show at least 8 digits of accuracy in your table. Your values should be in the interval [0, ]. (b) Plot the curve and each of the five extrema on a single graph. For this problem, you will use the MATLAB function fminbnd, a function which finds the minimum value of a function in an interval [a, b]. For this problem, set the tolerance TolX to
(see doc fminbnd for how to set the tolerance)
Hint: To get an idea of where the extrema are, plot curves x() and y() as functions of . Use these curves to isolate the minimum and maximum values to an interval [a, b] which you can then pass as an argument to the function fminbnd.
1. Finding extrema Consider the curve traced out by the set of parametric equations: x(@) = cos(x sin(e)) y(0) = cos(8) sin(x sin(e)) over the domain -ISOS. The curve is shown in the figure below (the right panel is the magnification of the left panel): Parametric curve Parametrie curve * 0 10 20 30 (a) Find the location of each of the five extrema shown as solid red or blue dots in the plots above. Print out a table (see doc table) indicating the values of each value at the extrema, and corresponding x() and yle) values. List the values in order of increasing and show at least 8 digits of accuracy in your table. Your values should be in the interval [0, 1] (b) Plot the curve and each of the five extrema on a single graph. For this problem, you will use the MATLAB function fminbnd, a function which finds the minimum value of a function in an interval [a, b]. For this problem, set the tolerance Tolxto tol = 1 x 10- (see doc fminbnd for how to set the tolerance) Hint: To get an idea of where the extrema are, plot curves (c) and yie) as functions of Use these curves to isolate the minimum and maximum values to an interval (a, b) which you can then pass as an argument to the function fminbnd. 1. Finding extrema Consider the curve traced out by the set of parametric equations: x(@) = cos(x sin(e)) y(0) = cos(8) sin(x sin(e)) over the domain -ISOS. The curve is shown in the figure below (the right panel is the magnification of the left panel): Parametric curve Parametrie curve * 0 10 20 30 (a) Find the location of each of the five extrema shown as solid red or blue dots in the plots above. Print out a table (see doc table) indicating the values of each value at the extrema, and corresponding x() and yle) values. List the values in order of increasing and show at least 8 digits of accuracy in your table. Your values should be in the interval [0, 1] (b) Plot the curve and each of the five extrema on a single graph. For this problem, you will use the MATLAB function fminbnd, a function which finds the minimum value of a function in an interval [a, b]. For this problem, set the tolerance Tolxto tol = 1 x 10- (see doc fminbnd for how to set the tolerance) Hint: To get an idea of where the extrema are, plot curves (c) and yie) as functions of Use these curves to isolate the minimum and maximum values to an interval (a, b) which you can then pass as an argument to the function fminbnd
Step by Step Solution
There are 3 Steps involved in it

Get step-by-step solutions from verified subject matter experts