

Question: Please do it on paper, not on excel. Thank you! 1. Calculate the financial ratios of D&G Co. for 2019 and interpret the financial position
 Please do it on paper, not on excel. Thank you!
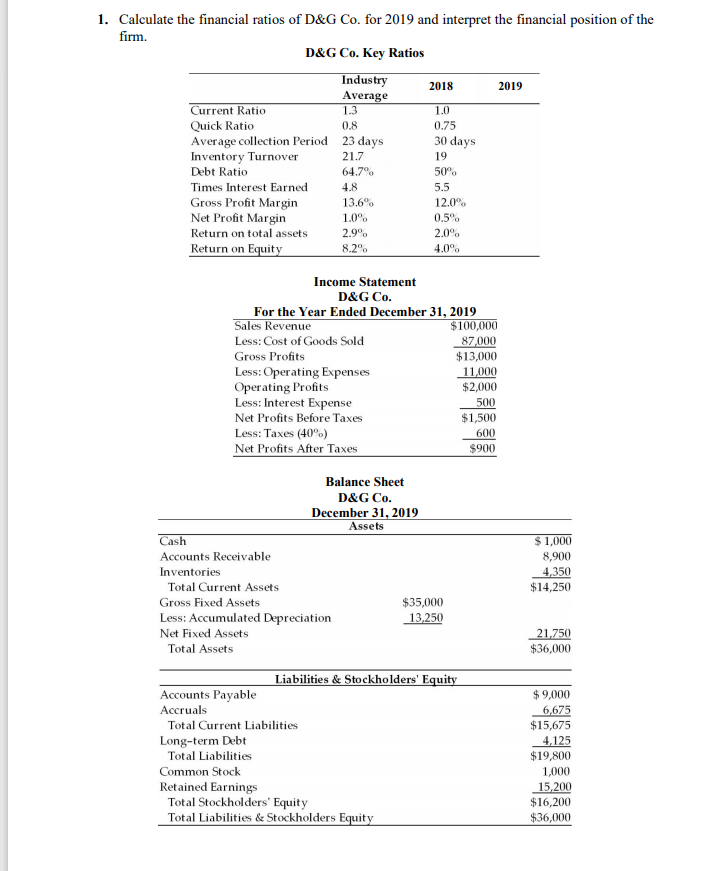
1. Calculate the financial ratios of D&G Co. for 2019 and interpret the financial position of the firm. D&G Co. Key Ratios Industry 2018 2019 Average Current Ratio 1.3 1.0 Quick Ratio 0.8 0.75 Average collection Period 23 days Inventory Turnover 21.7 19 Debt Ratio 64.7 50% Times Interest Earned 4.8 5.5 Gross Profit Margin 13.6 12.0 Net Profit Margin 1.0% 0.5% Return on total assets 2.99 2.0% Return on Equity 8.2% 4.0% 30 days Income Statement D&G Co. For the Year Ended December 31, 2019 Sales Revenue $100,000 Less: Cost of Goods Sold 87,000 Gross Profits $13,000 Less: Operating Expenses 11,000 Operating Profits $2,000 Less: Interest Expense 500 Net Profits Before Taxes $1,500 Less: Taxes (40%) 600 Net Profits After Taxes $900 $1,000 8,900 4,350 $14,250 Balance Sheet D&G Co. December 31, 2019 Assets Cash Accounts Receivable Inventories Total Current Assets Gross Fixed Assets $35,000 Less: Accumulated Depreciation 13,250 Net Fixed Assets Total Assets Liabilities & Stockholders' Equity Accounts Payable Accruals Total Current Liabilities Long-term Debt Total Liabilities Common Stock Retained Earnings Total Stockholders' Equity Total Liabilities & Stockholders Equity 21,750 $36,000 $ 9,000 6,675 $15,675 4,125 $19,800 1,000 15,200 $16,200 $36,000
Step by Step Solution
There are 3 Steps involved in it

Get step-by-step solutions from verified subject matter experts