

Question: 1. Draw a demand curve for economics classes at HCCC, showing the trade-off between price and quantity. Now draw another demand curve to the
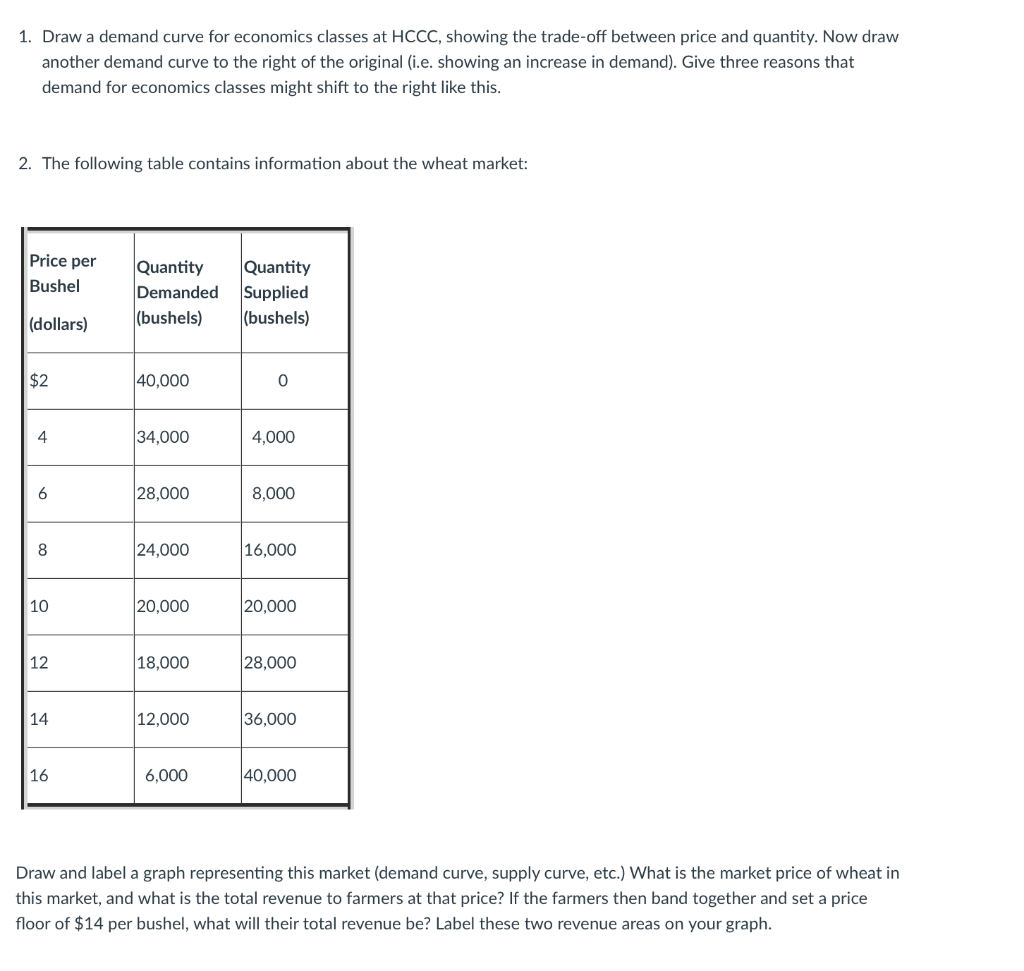
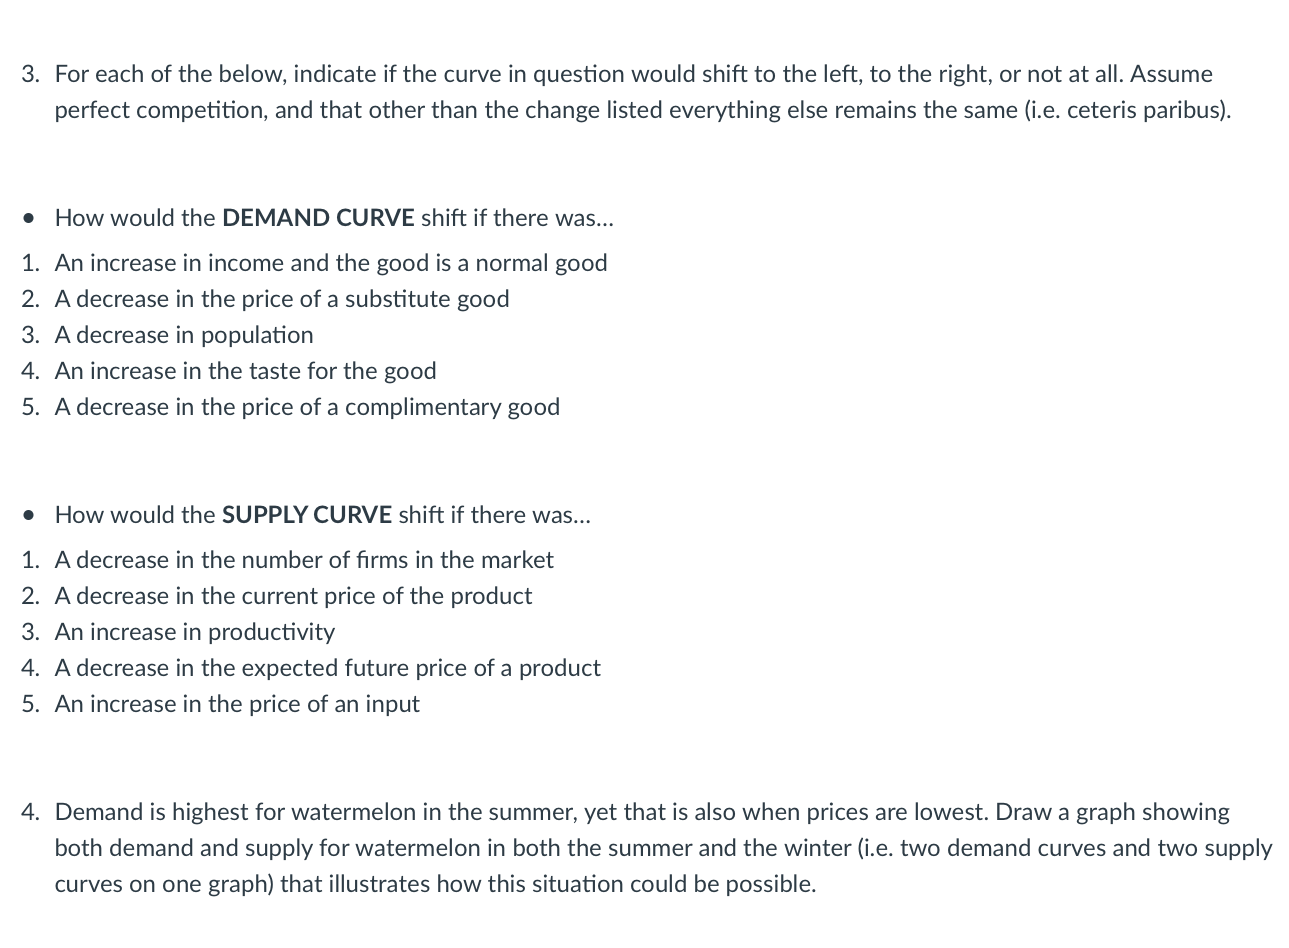
1. Draw a demand curve for economics classes at HCCC, showing the trade-off between price and quantity. Now draw another demand curve to the right of the original (i.e. showing an increase in demand). Give three reasons that demand for economics classes might shift to the right like this. 2. The following table contains information about the wheat market: Price per Quantity Bushel (dollars) $2 4 6 8 10 12 14 16 Quantity Demanded Supplied (bushels) (bushels) 40,000 34,000 28,000 24,000 20,000 18,000 12,000 6,000 0 4,000 8,000 16,000 20,000 28,000 36,000 40,000 Draw and label a graph representing this market (demand curve, supply etc.) What is the market price of wheat in this market, and what is the total revenue to farmers at that price? If the farmers then band together and set a price floor of $14 per bushel, what will their total revenue be? Label these two revenue areas on your graph. 3. For each of the below, indicate if the curve in question would shift to the left, to the right, or not at all. Assume perfect competition, and that other than the change listed everything else remains the same (i.e. ceteris paribus). How would the DEMAND CURVE shift if there was... 1. An increase in income and the good is a normal good 2. A decrease in the price of a substitute good 3. A decrease in population 4. An increase in the taste for the good 5. A decrease in the price of a complimentary good How would the SUPPLY CURVE shift if there was... 1. A decrease in the number of firms in the market 2. A decrease in the current price of the product 3. An increase in productivity 4. A decrease in the expected future price of a product 5. An increase in the price of an input 4. Demand is highest for watermelon in the summer, yet that is also when prices are lowest. Draw a graph showing both demand and supply for watermelon in both the summer and the winter (i.e. two demand curves and two supply curves on one graph) that illustrates how this situation could be possible.
Step by Step Solution
3.28 Rating (154 Votes )
There are 3 Steps involved in it
1 Demand Curve for Economics Classes To draw a demand curve for economics classes at HCCC well plot the tradeoff between price and quantity The demand ... View full answer

Get step-by-step solutions from verified subject matter experts