

Question: please do not hard-code your answers or inputs that can be cell referenced. Module 3. Student Ch 02 P14 Build a Model 4 5 a.
please do not hard-code your answers or inputs that can be cell referenced.
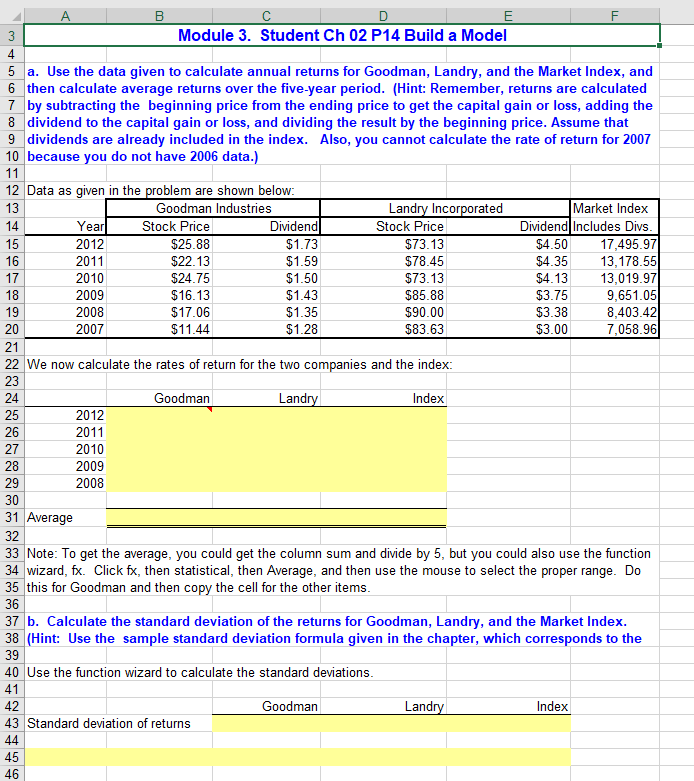
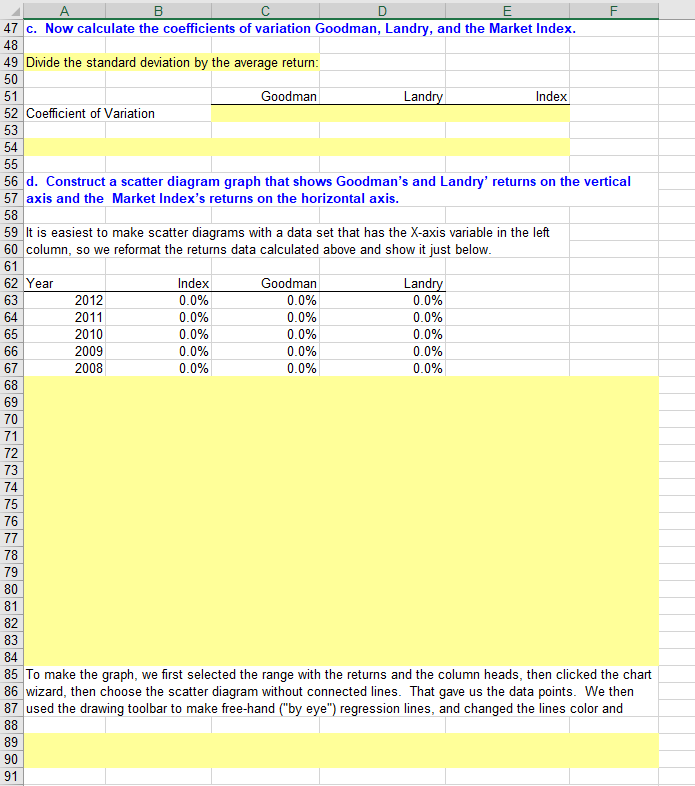
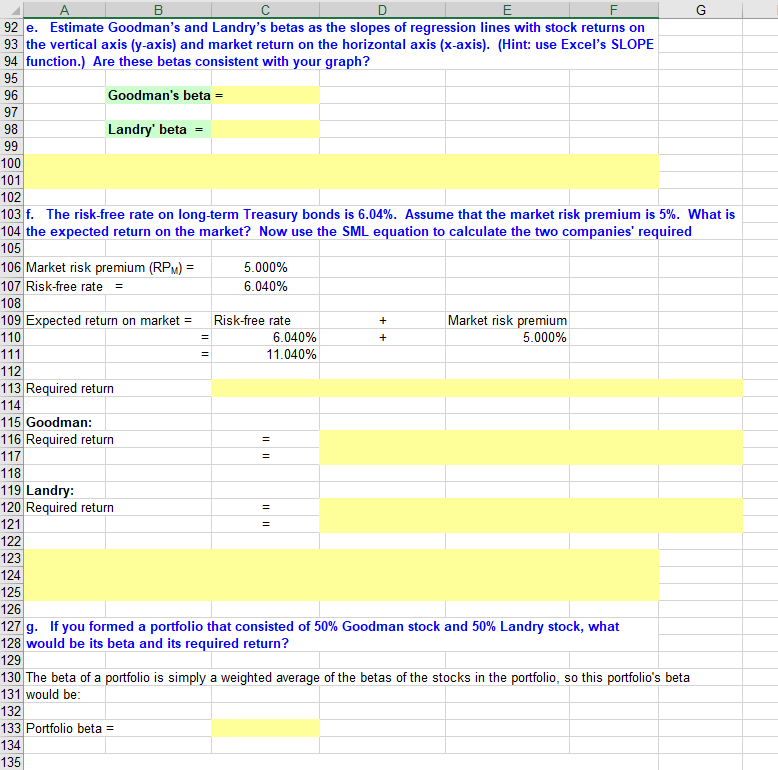
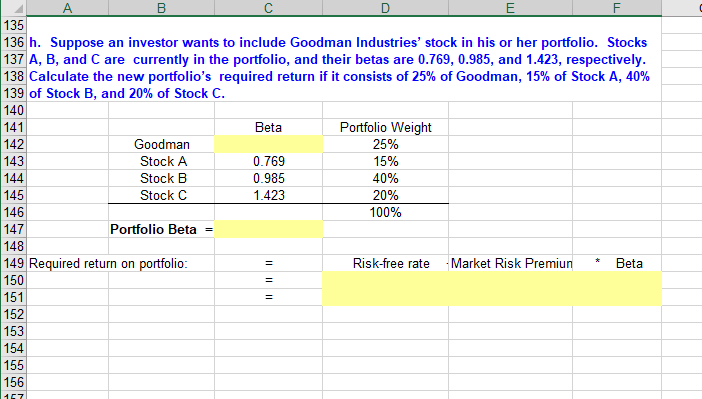
Module 3. Student Ch 02 P14 Build a Model 4 5 a. Use the data given to calculate annual returns for Goodman, Landry, and the Market Index, and 6 then calculate average returns over the five-year period. (Hint: Remember, returns are calculated 7 by subtracting the beginning price from the ending price to get the capital gain or loss, adding the 8 dividend to the capital gain or loss, and dividing the result by the beginning price. Assume that 9 dividends are already included in the index. Also, you cannot calculate the rate of return for 2007 10 because you do not have 2006 data.) 11 12 Data as given in the problem are shown below: Landry Incorporated Market Index Dividend Includes Divs 17,495.97 13,178.55 13,019.97 13 Goodman Industries Stock Price Dividend Year 14 Stock Price 2012 $73.13 15 $25.88 $1.73 $4.50 $1.59 16 2011 $22.13 $78.45 $4.35 2010 17 $24.75 $1.50 $73.13 $4.13 18 2009 $16.13 $1.43 $85.88 $3.75 9,651.05 8,403.42 $17.06 $3.38 19 2008 $1.35 $90.00 20 2007 $11.44 $1.28 $83.63 $3.00 7,058.96 21 22 We now calculate the rates of return for the two companies and the index: 23 Landry 24 Goodman Index 25 2012 2011 26 2010 27 28 2009 29 2008 30 31 Average 32 33 Note: To get the average, you could get the column sum and divide by 5, but you could also use the function 34 wizard, fx. Click fx, then statistical, then Average, and then use the mouse to select the proper range. Do 35 this for Goodman and then copy the cell for the other items. 36 37 b. Calculate the standard deviation of the returns for Goodman, Landry, and the Market Index. 38 (Hint: Use the sample standard deviation formula given in the chapter, which corresponds to the 39 40 Use the function wizard to calculate the standard deviations. 41 Landry 42 Goodman Index 43 Standard deviation of returns 44 45 46 A 47 c. Now calculate the coefficients of variation Goodman, Landry, and the Market Index. 48 49 Divide the standard deviation by the average return: 50 Landry 51 Goodman Index 52 Coefficient of Variation 53 54 55 56 d. Construct a scatter diagram graph that shows Goodman's and Landry' returns on the vertical 57 axis and the Market Index's returns on the horizontal axis. 58 59 It is easiest to make scatter diagrams with a data set tha as the X-axis variable in 60 column, so we reformat the returns data calculated above and show it just below. 61 62 Year Index Goodman Landry 0.0% 2012 63 0.0% 0.0% 0.0% 64 2011 0.0% 0.0% 65 2010 0.0% 0.0% 0.0% 66 2009 0.0% 0.0% 0.0% 2008 0.0% 0.0% 67 0.0% 68 69 70 71 72 73 74 75 76 77 78 79 80 81 82 83 84 85 To make the graph, we first selected the range with the returns and the column heads, then clicked the chart 86 wizard, then choose the scatter diagram without connected lines. That gave us the data points. We then 87 used the drawing toolbar to make free-hand ("by eye") regression lines, and changed the lines color and 88 89 90 91 A 92 e. Estimate Goodman's and Landry's betas as the slopes of regression lines with stock returns on 93 the vertical axis (y-axis) and market return on the horizontal axis (x-axis). (Hint: use Excel's SLOPE 94 function.) Are these betas consistent with your graph? 95 96 Goodman's beta = 97 98 Landry' beta = 99 100 101 102 103 f. The risk-free rate on long-term Treasury bonds is 6.04%. Assume that the market risk premium is 5%. What is 104 the expected return on the market? Now use the SML equation to calculate the two companies' required 105 106 Market risk premium (RPM) = 5.000% 6.040% 107 Risk-free rate 108 109 Expected return on market = Market risk premium Risk-free rate 5.000% 110 6.040% 111 11.040% 112 113 Required return 114 115 Goodman: 116 Required return 117 118 119 Landry: 120 Required return 121 122 123 124 125 126 127 g. If you formed a portfolio that consisted of 50% Goodman stock and 50% Landry stock, what 128 would be its beta and its required return? 129 130 The beta of a portfolio is simply a weighted average of the betas of the stocks in the portfolio, so this portfolio's beta 131 would be: 132 133 Portfolio beta = 134 135 II || I || 135 136 h. Suppose an investor wants to include Goodman Industries' stock in his or her portfolio. Stocks 137 A, B, and C are currently in the portfolio, and their betas are 0.769, 0.985, and 1.423, respectively. 138 Calculate the new portfolio's required return if it consists of 25% of Goodman, 15% of Stock A, 40% 139 of Stock B, and 20% of Stock C. 140 141 142 143 144 145 146 147 148 149 Required return on portfolio: 150 151 152 153 154 155 156 Portfolio Weight Beta Goodman 25% 0.769 Stock A 15% Stock B 0.985 40% Stock C 1.423 20% 100% Portfolio Beta - Risk-free rate Market Risk Premiun Beta II ||||
Step by Step Solution
There are 3 Steps involved in it

Get step-by-step solutions from verified subject matter experts