

Question: PLEASE DO NOT JUST COPY ANSWER FROM THE INTERNET. (PART II) 4. This question relates to the plots in Figure 8.12. (a) Sketch the tree
PLEASE DO NOT JUST COPY ANSWER FROM THE INTERNET. (PART II)
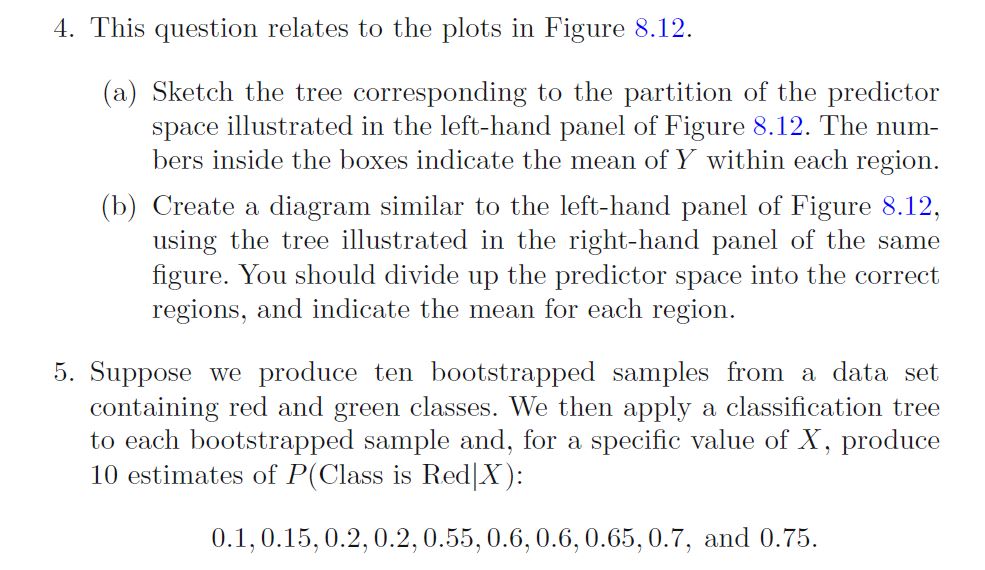

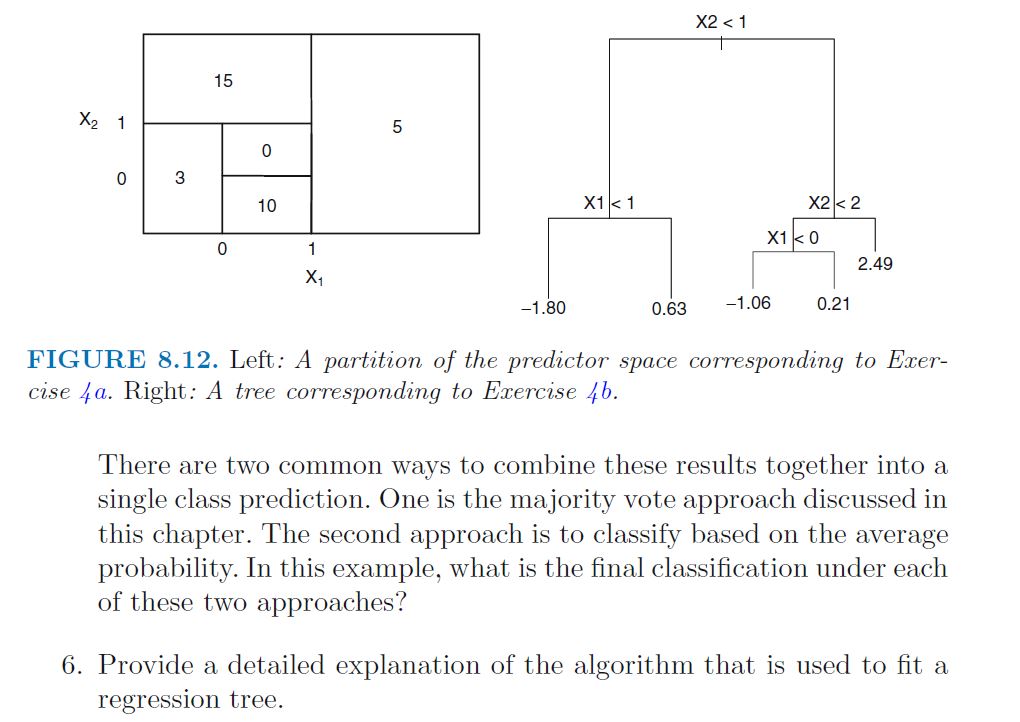
4. This question relates to the plots in Figure 8.12. (a) Sketch the tree corresponding to the partition of the predictor space illustrated in the left-hand panel of Figure 8.12. The num- bers inside the boxes indicate the mean of Y within each region. (b) Create a diagram similar to the left-hand panel of Figure 8.12, using the tree illustrated in the righthand panel of the same gure. You should divide up the predictor space into the correct regions, and indicate the mean for each region. 5. Suppose we produce ten bootstrapped samples from a data set containing red and green classes. We then apply a classication tree to each bootstrapped sample and, for a specic value of X, produce 10 estimates of P(Class is Red|X): 0.1, 0.15, 0.2, 0.2, 0.55, 0.6, 0.6, 0.65, 0.7, and 0.75. X241 0 x1
Step by Step Solution
There are 3 Steps involved in it

Get step-by-step solutions from verified subject matter experts