

Question: Please do not provide an explanation just answer the question and I will give a thumbs up and a great review thank you very much!
Please do not provide an explanation just answer the question and I will give a thumbs up and a great review thank you very much!
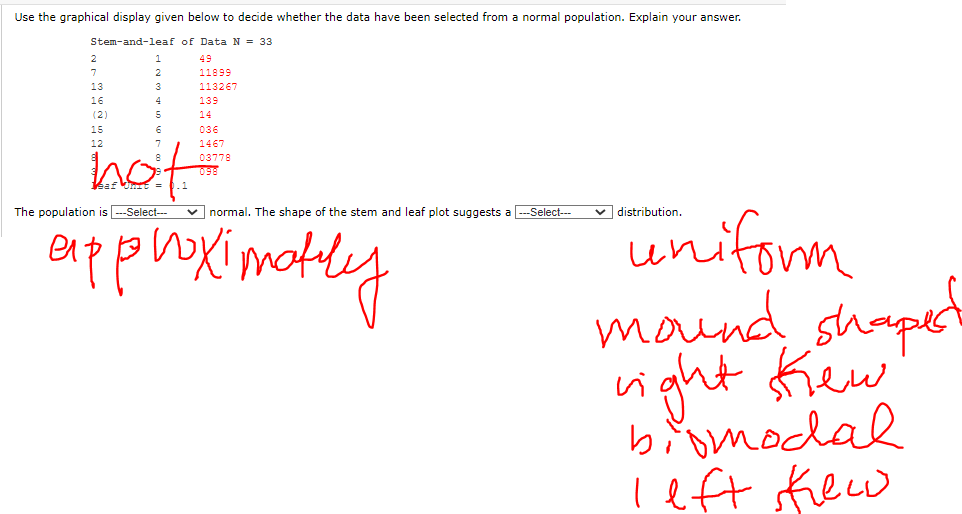
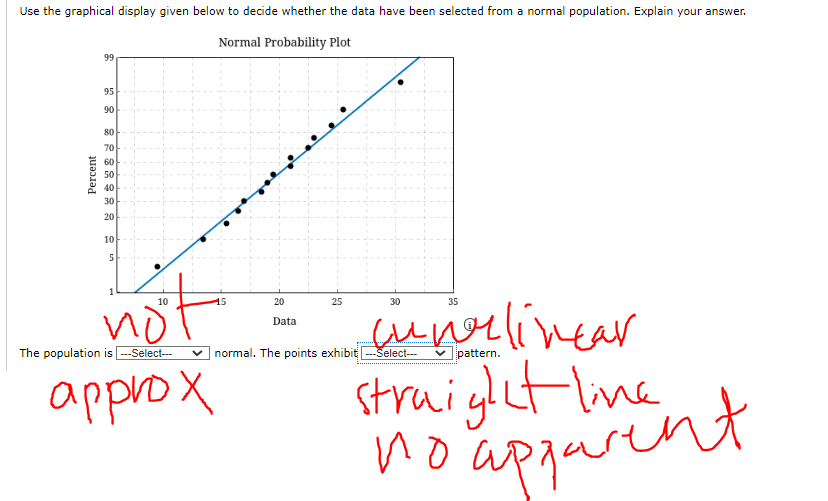
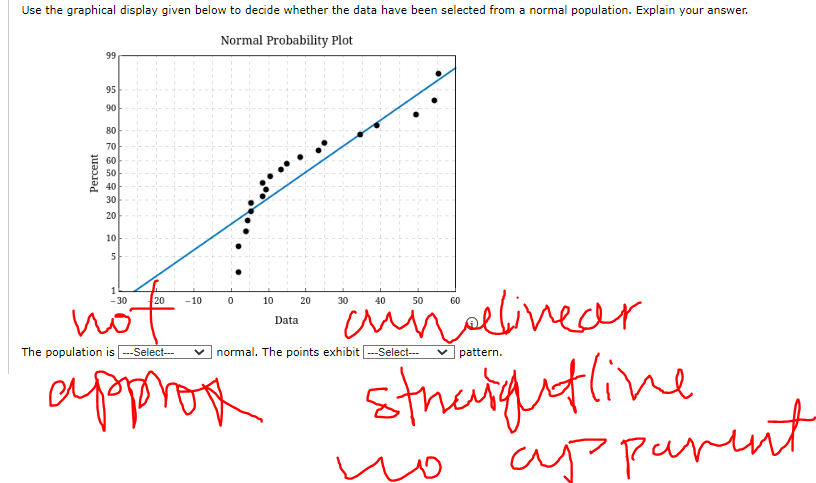
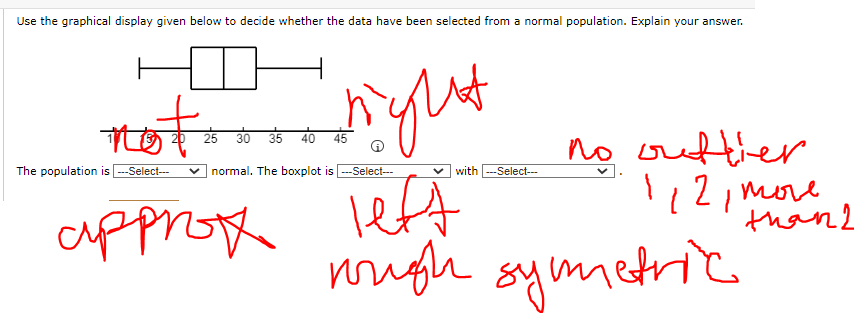
\fUse 1e graphical display:r given below to decide whether the data have been selected from a normal population. Explain your answen Normal Probability Plot :2 Percent 31553338 32':- n.- VIII: Use the glaphieal display:r given below to decide whether the data have been selected from a normal population. Explain your answer Normal Probability Plot S D U1 Permnt 3833338 3 normal. The points emibitm pattern. gW'/iv ' k/k/'D The population is
Step by Step Solution
There are 3 Steps involved in it
1 Expert Approved Answer
Step: 1 Unlock

Question Has Been Solved by an Expert!
Get step-by-step solutions from verified subject matter experts
Step: 2 Unlock
Step: 3 Unlock