

Question: PLEASE DO NOT SPAM WITH A SOLUTION THAT IS ALREADY ON CHEGG. Electron diffraction and the sample thickness When an energetic electron enters a medium,
PLEASE DO NOT SPAM WITH A SOLUTION THAT IS ALREADY ON CHEGG.
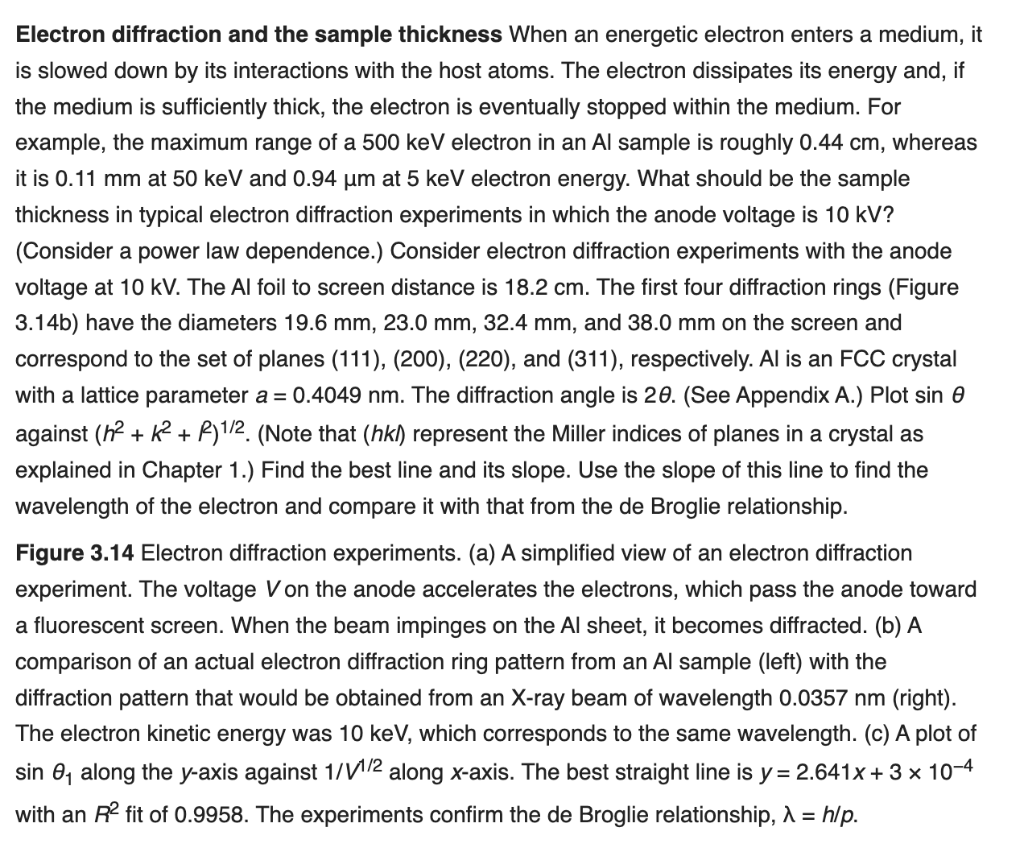
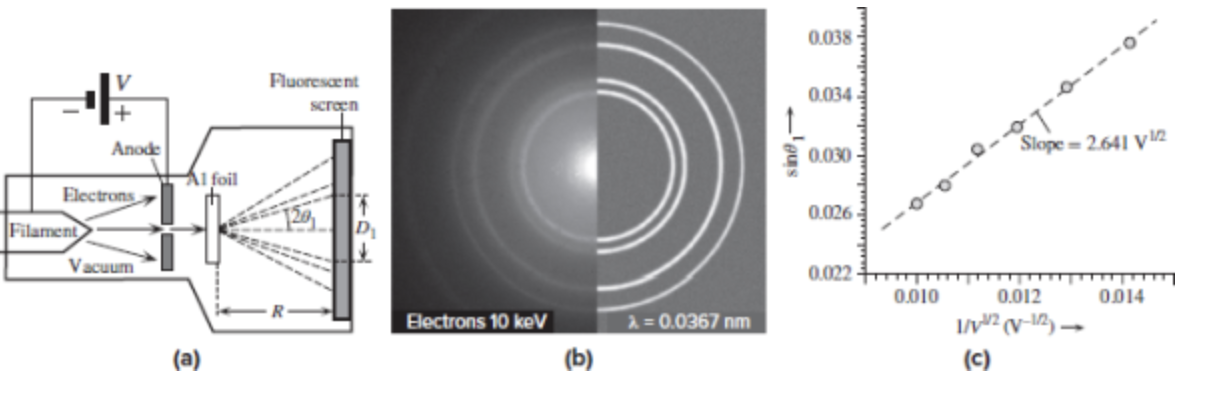
Electron diffraction and the sample thickness When an energetic electron enters a medium, it is slowed down by its interactions with the host atoms. The electron dissipates its energy and, if the medium is sufficiently thick, the electron is eventually stopped within the medium. For example, the maximum range of a 500 keV electron in an Al sample is roughly 0.44 cm, whereas it is 0.11 mm at 50 keV and 0.94 um at 5 keV electron energy. What should be the sample thickness in typical electron diffraction experiments in which the anode voltage is 10 kV? (Consider a power law dependence.) Consider electron diffraction experiments with the anode voltage at 10 kV. The Al foil to screen distance is 18.2 cm. The first four diffraction rings (Figure 3.14b) have the diameters 19.6 mm, 23.0 mm, 32.4 mm, and 38.0 mm on the screen and correspond to the set of planes (111), (200), (220), and (311), respectively. Al is an FCC crystal with a lattice parameter a = 0.4049 nm. The diffraction angle is 20. (See Appendix A.) Plot sin against (h2 + R2 + R) 1/2. (Note that (hk) represent the Miller indices of planes in a crystal as explained in Chapter 1.) Find the best line and its slope. Use the slope of this line to find the wavelength of the electron and compare it with that from the de Broglie relationship. Figure 3.14 Electron diffraction experiments. (a) A simplified view of an electron diffraction experiment. The voltage Von the anode accelerates the electrons, which pass the anode toward a fluorescent screen. When the beam impinges on the Al sheet, it becomes diffracted. (b) A comparison of an actual electron diffraction ring pattern from an Al sample (left) with the diffraction pattern that would be obtained from an X-ray beam of wavelength 0.0357 nm (right). The electron kinetic energy was 10 keV, which corresponds to the same wavelength. (c) A plot of sin 0, along the y-axis against 1/V1/2 along x-axis. The best straight line is y = 2.641x + 3 x 10⁻⁴ with an R? fit of 0.9958. The experiments confirm the de Broglie relationship, 1 = hlp. 0.038 Fluorescent scron 0.034 Anode - ous 0.030 Slope = 2641 V12 Ai foil Electrons 17 128 0.026 Filament Vacuum 0.022 0.010 0.014 Electrons 10 keV = 0.0367 nm 0.012 1/6/2cv-12) (c) (a)
Step by Step Solution
There are 3 Steps involved in it

Get step-by-step solutions from verified subject matter experts