

Question: Please DO NOT use excel to answer this. 1 Problem description A manufacturer has two companies, one in Indiana and one in New York. In
Please DO NOT use excel to answer this.
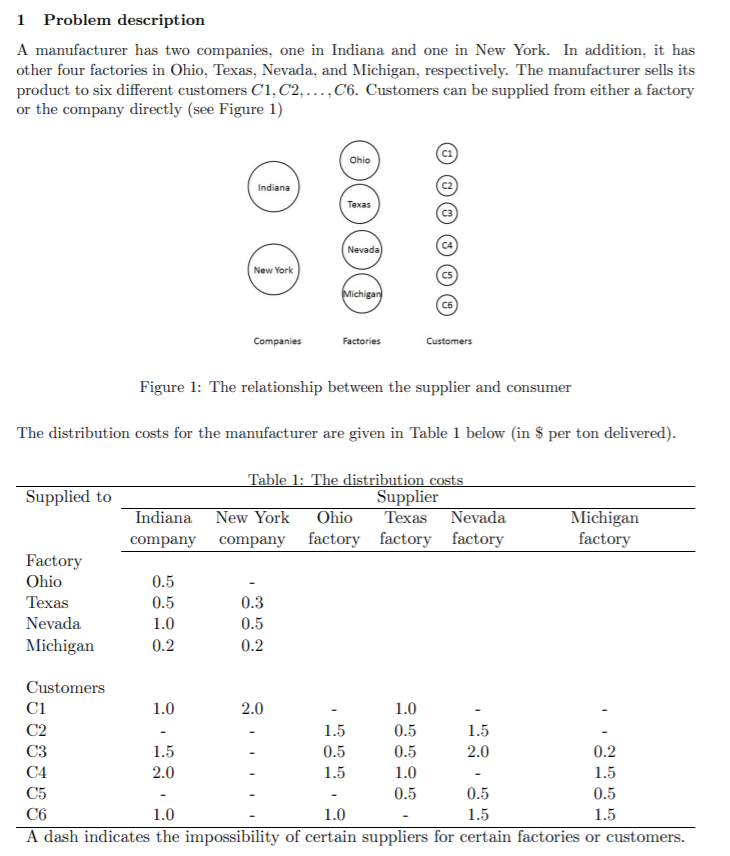
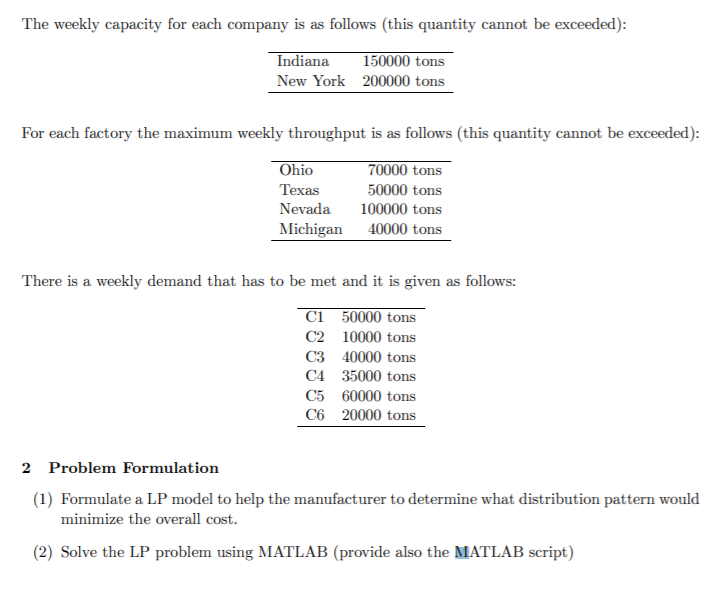
1 Problem description A manufacturer has two companies, one in Indiana and one in New York. In addition, it has other four factories in Ohio, Texas, Nevada, and Michigan, respectively. The manufacturer sells its product to six different customers C1, C2,...,C6. Customers can be supplied from either a factory or the company directly (see Figure 1) Ohio Indiana Texas Nevada New York Michigan Companies Factories Customers Figure 1: The relationship between the supplier and consumer The distribution costs for the manufacturer are given in Table 1 below (in $ per ton delivered). Supplied to Table 1: The distribution costs Supplier Indiana New York Ohio Texas Nevada company company factory factory factory Michigan factory Factory Ohio Texas Nevada Michigan 0.5 0.5 1.0 0.2 0.3 0.5 0.2 1.5 Customers C1 1.0 2.0 1.0 C2 1.5 0.5 C3 1.5 0.5 0.5 2.0 0.2 C4 2.0 1.5 1.0 1.5 C5 0.5 0.5 0.5 C6 1.0 1.5 A dash indicates the impossibility of certain suppliers for certain factories or customers. 1.0 1.5 The weekly capacity for each company is as follows this quantity cannot be exceeded): Indiana 150000 tons New York 200000 tons For each factory the maximum weekly throughput is as follows this quantity cannot be exceeded): Ohio 70000 tons Texas 50000 tons Nevada 100000 tons Michigan 40000 tons There is a weekly demand that has to be met and it is given as follows: ci 50000 tons C2 10000 tons C3 40000 tons C4 35000 tons C5 60000 tons C6 20000 tons 2 Problem Formulation (1) Formulate a LP model to help the manufacturer to determine what distribution pattern would minimize the overall cost. (2) Solve the LP problem using MATLAB (provide also the MATLAB script) 1 Problem description A manufacturer has two companies, one in Indiana and one in New York. In addition, it has other four factories in Ohio, Texas, Nevada, and Michigan, respectively. The manufacturer sells its product to six different customers C1, C2,...,C6. Customers can be supplied from either a factory or the company directly (see Figure 1) Ohio Indiana Texas Nevada New York Michigan Companies Factories Customers Figure 1: The relationship between the supplier and consumer The distribution costs for the manufacturer are given in Table 1 below (in $ per ton delivered). Supplied to Table 1: The distribution costs Supplier Indiana New York Ohio Texas Nevada company company factory factory factory Michigan factory Factory Ohio Texas Nevada Michigan 0.5 0.5 1.0 0.2 0.3 0.5 0.2 1.5 Customers C1 1.0 2.0 1.0 C2 1.5 0.5 C3 1.5 0.5 0.5 2.0 0.2 C4 2.0 1.5 1.0 1.5 C5 0.5 0.5 0.5 C6 1.0 1.5 A dash indicates the impossibility of certain suppliers for certain factories or customers. 1.0 1.5 The weekly capacity for each company is as follows this quantity cannot be exceeded): Indiana 150000 tons New York 200000 tons For each factory the maximum weekly throughput is as follows this quantity cannot be exceeded): Ohio 70000 tons Texas 50000 tons Nevada 100000 tons Michigan 40000 tons There is a weekly demand that has to be met and it is given as follows: ci 50000 tons C2 10000 tons C3 40000 tons C4 35000 tons C5 60000 tons C6 20000 tons 2 Problem Formulation (1) Formulate a LP model to help the manufacturer to determine what distribution pattern would minimize the overall cost. (2) Solve the LP problem using MATLAB (provide also the MATLAB script)Step by Step Solution
There are 3 Steps involved in it
1 Expert Approved Answer
Step: 1 Unlock

Question Has Been Solved by an Expert!
Get step-by-step solutions from verified subject matter experts
Step: 2 Unlock
Step: 3 Unlock