

Question: Please do NOT use import pandas or import math, thank you so much! Filename: nola_v1.py Also submit: A screenshot (or download) of your plot Input
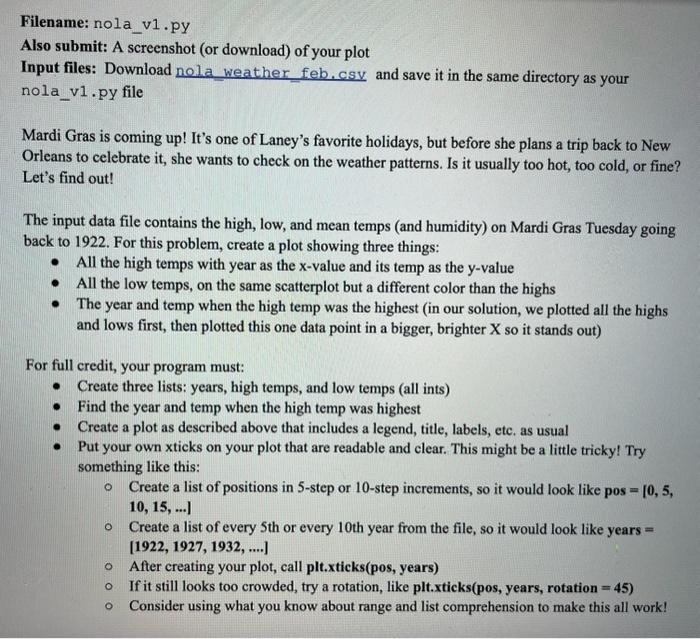
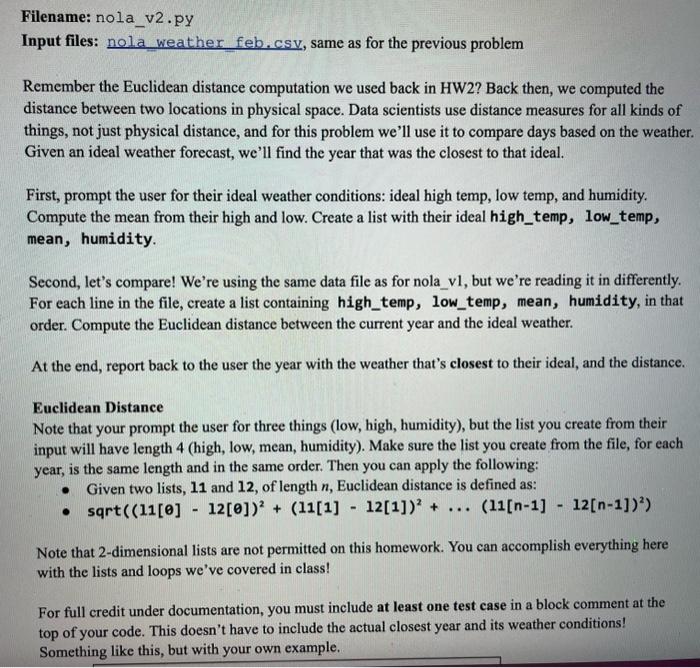
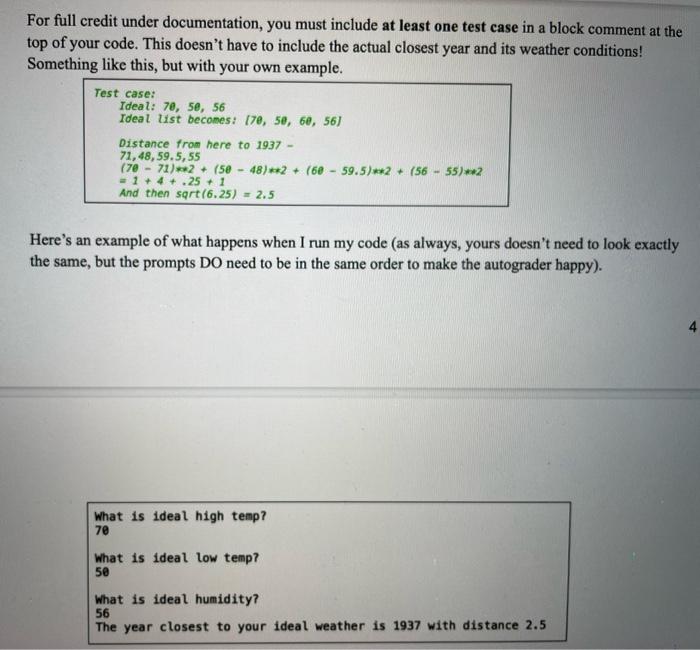
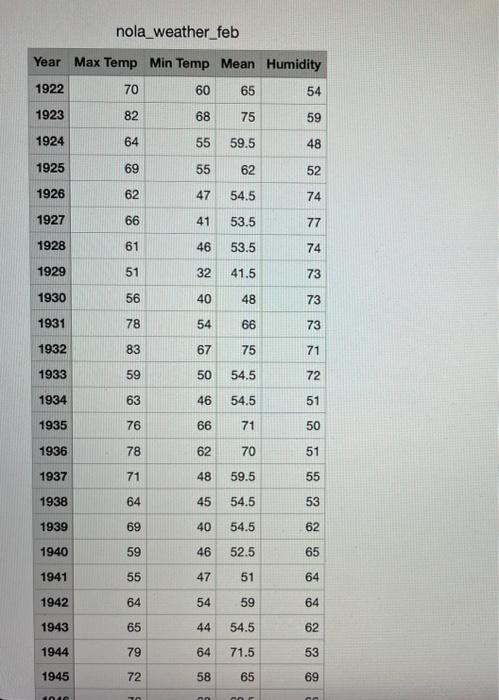
Filename: nola_v1.py Also submit: A screenshot (or download) of your plot Input files: Download nola weather feb. csv and save it in the same directory as your nola_v1.py file Mardi Gras is coming up! It's one of Laney's favorite holidays, but before she plans a trip back to New Orleans to celebrate it, she wants to check on the weather patterns. Is it usually too hot, too cold, or fine? Let's find out! The input data file contains the high, low, and mean temps (and humidity) on Mardi Gras Tuesday going back to 1922. For this problem, create a plot showing three things: - All the high temps with year as the x-value and its temp as the y-value - All the low temps, on the same scatterplot but a different color than the highs - The year and temp when the high temp was the highest (in our solution, we plotted all the highs and lows first, then plotted this one data point in a bigger, brighter X so it stands out) For full credit, your program must: - Create three lists: years, high temps, and low temps (all ints) - Find the year and temp when the high temp was highest - Create a plot as described above that includes a legend, title, labels, etc. as usual - Put your own xticks on your plot that are readable and clear. This might be a little tricky! Try something like this: - Create a list of positions in 5-step or 10 -step increments, so it would look like pos =[0,5, 10,15,] - Create a list of every 5 th or every 10 th year from the file, so it would look like years = [1922,1927,1932,] After creating your plot, call plt.xticks(pos, years) - If it still looks too crowded, try a rotation, like plt.xticks(pos, years, rotation =45 ) - Consider using what you know about range and list comprehension to make this all work! Filename: nola_v2.py Input files: nola weather feb. csv, same as for the previous problem Remember the Euclidean distance computation we used back in HW2? Back then, we computed the distance between two locations in physical space. Data scientists use distance measures for all kinds of things, not just physical distance, and for this problem we'll use it to compare days based on the weather. Given an ideal weather forecast, we'll find the year that was the closest to that ideal. First, prompt the user for their ideal weather conditions: ideal high temp, low temp, and humidity. Compute the mean from their high and low. Create a list with their ideal high_temp, low_temp, mean, humidity. Second, let's compare! We're using the same data file as for nola_vl, but we're reading it in differently. For each line in the file, create a list containing high_temp, low_temp, mean, humidity, in that order. Compute the Euclidean distance between the current year and the ideal weather. At the end, report back to the user the year with the weather that's closest to their ideal, and the distance. Euclidean Distance Note that your prompt the user for three things (low, high, humidity), but the list you create from their input will have length 4 (high, low, mean, humidity). Make sure the list you create from the file, for each year, is the same length and in the same order. Then you can apply the following: - Given two lists, 11 and 12, of length n, Euclidean distance is defined as: - sqrt((11[]12[0])2+(11[1]12[1])2+(11[n1]12[n1])2) Note that 2-dimensional lists are not permitted on this homework. You can accomplish everything here with the lists and loops we've covered in class! For full credit under documentation, you must include at least one test case in a block comment at the top of your code. This doesn't have to include the actual closest year and its weather conditions! Something like this, but with your own example. For full credit under documentation, you must include at least one test case in a block comment at the top of your code. This doesn't have to include the actual closest year and its weather conditions! Something like this, but with your own example. Test case: Ideal: 7e, 5e, 56 Ideal list becomes: [7,5e,6e,56] Distance from here to 1937 71,48,59,5,55 (7071)+2+(548)2+(6e59.5)2+(5655)+2 =1+4+.25+1 And then sqrt(6,25)=2.5 Here's an example of what happens when I run my code (as always, yours doesn't need to look exactly the same, but the prompts DO need to be in the same order to make the autograder happy). nola_weather_feb \begin{tabular}{|l|r|r|r|r|} \hline Year & Max Temp & Min Temp & Mean & Humidity \\ \hline 1922 & 70 & 60 & 65 & 54 \\ \hline 1923 & 82 & 68 & 75 & 59 \\ \hline 1924 & 64 & 55 & 59.5 & 48 \\ \hline 1925 & 69 & 55 & 62 & 52 \\ \hline 1926 & 62 & 47 & 54.5 & 74 \\ \hline 1927 & 66 & 41 & 53.5 & 77 \\ \hline 1928 & 61 & 46 & 53.5 & 74 \\ \hline 1929 & 51 & 32 & 41.5 & 73 \\ \hline 1930 & 56 & 40 & 48 & 73 \\ \hline 1931 & 78 & 54 & 66 & 73 \\ \hline 1932 & 83 & 67 & 75 & 71 \\ \hline 1933 & 59 & 50 & 54.5 & 72 \\ \hline 1934 & 63 & 46 & 54.5 & 51 \\ \hline 1935 & 76 & 66 & 71 & 50 \\ \hline 1936 & 78 & 62 & 70 & 51 \\ \hline 1937 & 71 & 48 & 59.5 & 55 \\ \hline 1938 & 64 & 45 & 54.5 & 53 \\ \hline 1939 & 69 & 40 & 54.5 & 62 \\ \hline 1940 & 59 & 46 & 52.5 & 65 \\ \hline 1941 & 55 & 47 & 51 & 64 \\ \hline 1942 & 64 & 54 & 59 & 64 \\ \hline 1943 & 65 & 44 & 54.5 & 62 \\ \hline 1944 & 79 & 64 & 71.5 & 53 \\ \hline 1945 & 72 & 58 & 65 & 69 \\ \hline \end{tabular}
Step by Step Solution
There are 3 Steps involved in it

Get step-by-step solutions from verified subject matter experts