

Question: please do number 2, and the graph with excel Q1. The MRT in a 11340 ' deep well is 240F. Circulation was stopped at 12.30
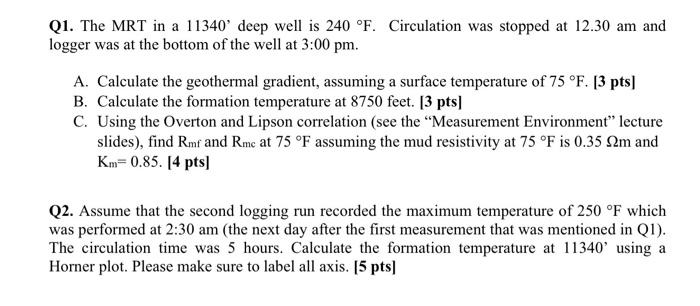
Q1. The MRT in a 11340 ' deep well is 240F. Circulation was stopped at 12.30 am and logger was at the bottom of the well at 3:00pm. A. Calculate the geothermal gradient, assuming a surface temperature of 75F. [3 pts] B. Calculate the formation temperature at 8750 feet. [3 pts] C. Using the Overton and Lipson correlation (see the "Measurement Environment" lecture slides), find Rmf and Rmcm at 75F assuming the mud resistivity at 75F is 0.35m and Km=0.85. [4 pts] Q2. Assume that the second logging run recorded the maximum temperature of 250F which was performed at 2:30 am (the next day after the first measurement that was mentioned in Q1). The circulation time was 5 hours. Calculate the formation temperature at 11340 ' using a Horner plot. Please make sure to label all axis. [5 pts]
Step by Step Solution
There are 3 Steps involved in it

Get step-by-step solutions from verified subject matter experts