

Question: Please do part C set up the r-chart by specifying the three sigma control limits blow. The uclR equals ____ and the lclR equals ___
Please do part C
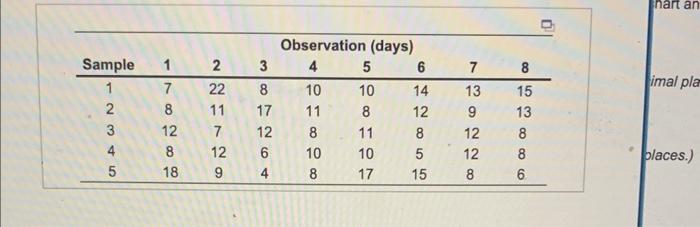
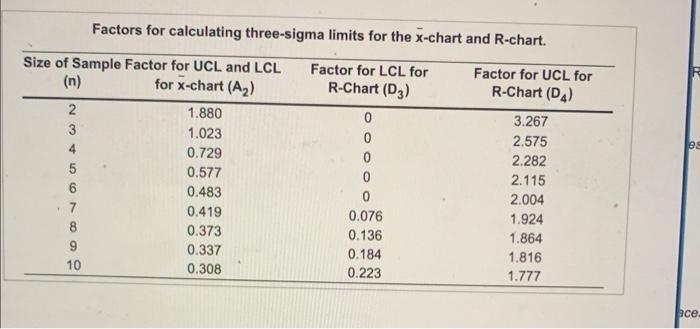
The Digital Guardian Company issues policies that protect clients from downtime costs due to computer system failures. It is very important to process the policies quickly because long cycle times not only put the client at risk, they could also lose business for Digital Guardian. Management is concerned that customer service is degrading because of long cycle times, measured in days. The table contains the data from five samples, each sample consisting of eight random observations. Click the icon to view the table with sample data. Click the icon to view the table of factors for calculating three-sigma limits for the x-chart and R-chart. a. What is your estimate of the process average? The estimate of the process average is (Enter your response rounded to two decimal places.) b. What is your estimate of the average range? The estimate of the average range is (Enter your response rounded to two decimal places.) c. Construct an R - and an x-chart for this process. Set up the R-chart by specifying the three-sigma control limits below. The UCLR equals and the LCLR equals. (Enter your responses rounded to two decimal places.) Set up the x-chart by specifying the three-sigma control limits below. The UCLx equals and the LCLx equals (Enter your responses rounded to two decimal places) The process variability is statistical control and the process average is \begin{tabular}{ccccccccc} \hline & \multicolumn{8}{c}{ Observation (days) } \\ Sample & 1 & 2 & 3 & 4 & 5 & 6 & 7 & 8 \\ \hline 1 & 7 & 22 & 8 & 10 & 10 & 14 & 13 & 15 \\ 2 & 8 & 11 & 17 & 11 & 8 & 12 & 9 & 13 \\ 3 & 12 & 7 & 12 & 8 & 11 & 8 & 12 & 8 \\ 4 & 8 & 12 & 6 & 10 & 10 & 5 & 12 & 8 \\ 5 & 18 & 9 & 4 & 8 & 17 & 15 & 8 & 6 \\ \hline \end{tabular} places.) Factors for calculating three-sigma limits for the x-chart and R-chart set up the r-chart by specifying the three sigma control limits blow.
The uclR equals ____ and the lclR equals ___
set up the x chart by specifying the three sigma control limits below.
the uclX equals ___ and the lclx equals ___
the process variability is __(in / out)__ statistical control and the process average is ___(out of/in)___ statistical control 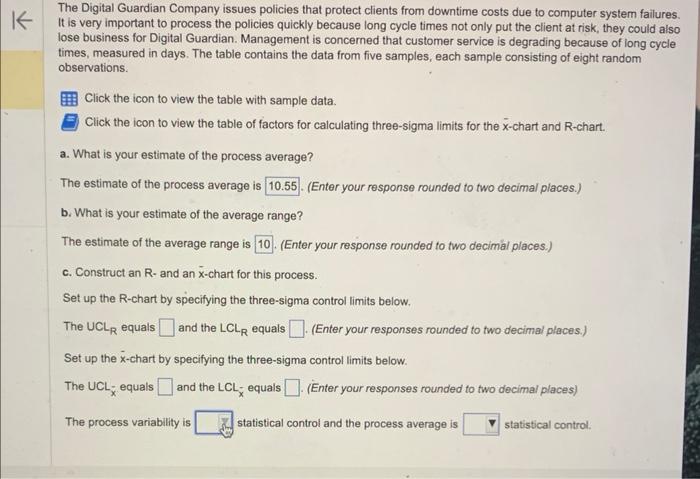
Step by Step Solution
There are 3 Steps involved in it
1 Expert Approved Answer
Step: 1 Unlock

Question Has Been Solved by an Expert!
Get step-by-step solutions from verified subject matter experts
Step: 2 Unlock
Step: 3 Unlock