

Question: Please do question 3 only (the ratios) *** Warning: The financial ratios presented in the sample projects are different from what required in the current
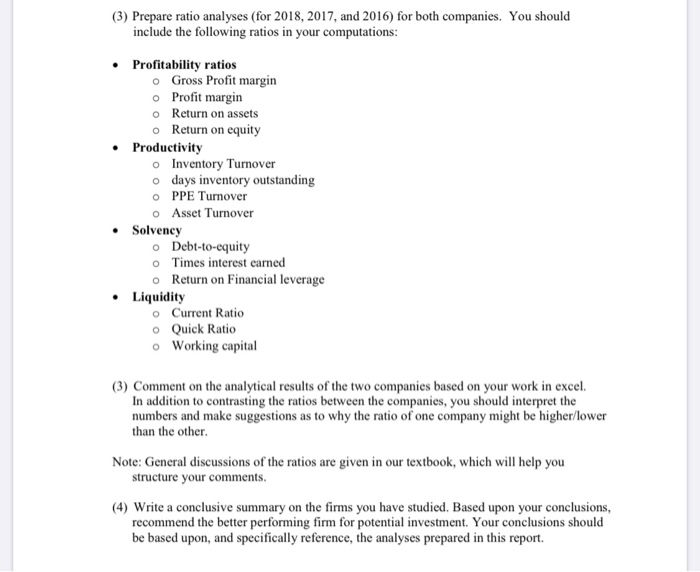
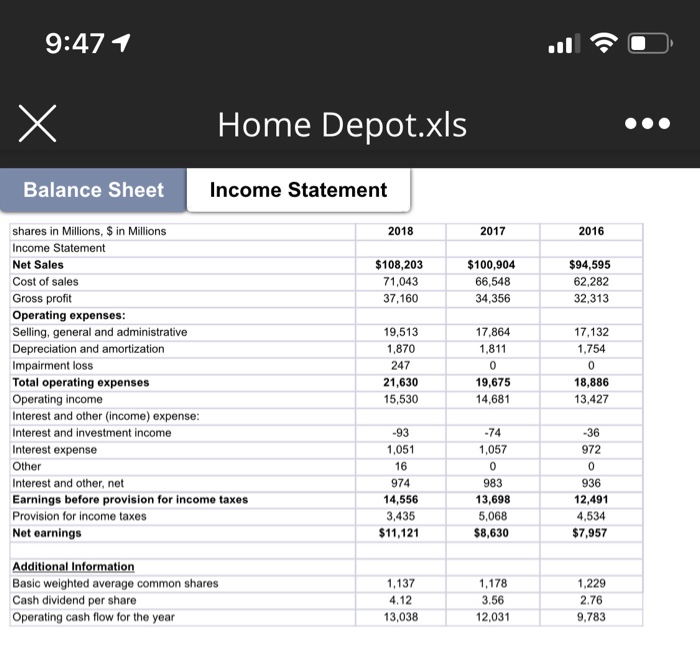
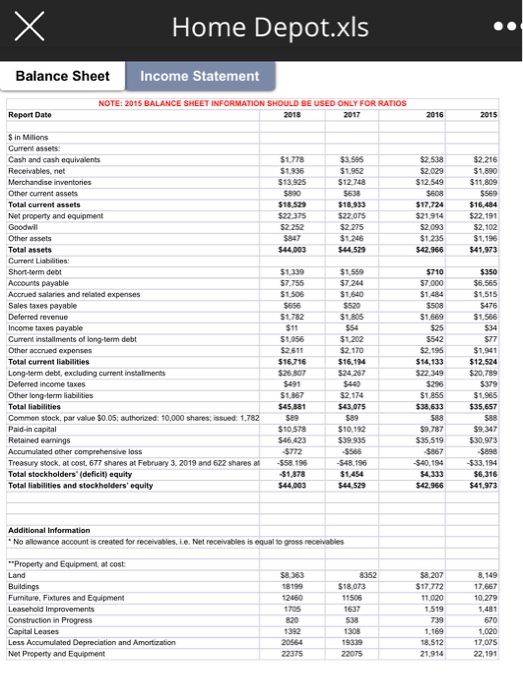
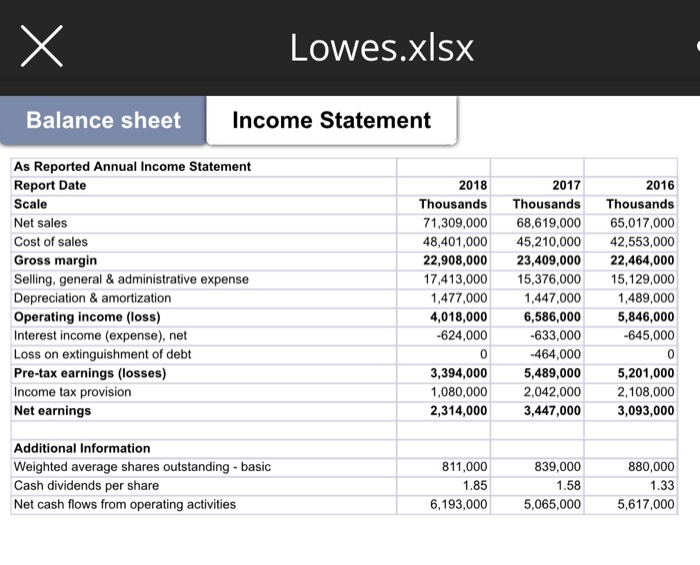
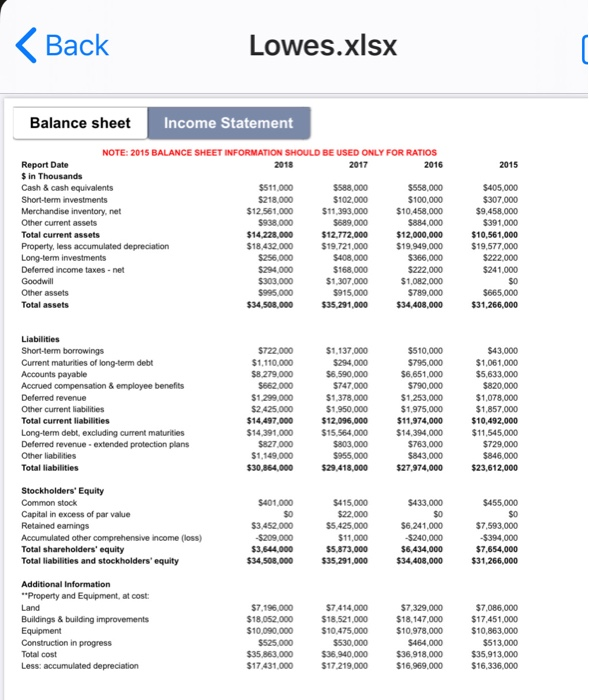
*** Warning: The financial ratios presented in the sample projects are different from what required in the current projects. Therefore, you CANNOT directly follow the samples. Some modification is needed. The specific purposes of the projects are: 1. Apply to actual companies the knowledge and analytical techniques learned from our course. 2. Perform vertical and horizontal analysis and various ratios on the financial statements. 3. Compare the calculated results with competitor and across different years. 4. Summarize the analyses and make investment recommendations. You will be analyzing the following firms: a. Home Depot (HD) b. Lowes (LOW). Please check the blackboard for the financial statements. (3) Prepare ratio analyses (for 2018, 2017, and 2016) for both companies. You should include the following ratios in your computations: Profitability ratios o Gross Profit margin o Profit margin O Return on assets O Return on equity Productivity o Inventory Turnover o days inventory outstanding OPPE Turnover O Asset Turnover Solvency O Debt-to-equity Times interest earned O Return on Financial leverage Liquidity o Current Ratio O Quick Ratio o Working capital (3) Comment on the analytical results of the two companies based on your work in excel. In addition to contrasting the ratios between the companies, you should interpret the numbers and make suggestions as to why the ratio of one company might be higher/lower than the other. Note: General discussions of the ratios are given in our textbook, which will help you structure your comments. (4) Write a conclusive summary on the firms you have studied. Based upon your conclusions, recommend the better performing firm for potential investment. Your conclusions should be based upon, and specifically reference, the analyses prepared in this report. 9:47 1 Home Depot.xls Balance Sheet Income Statement 2018 2017 2016 $108,203 71,043 37,160 $100,904 66,548 34,356 $94,595 62,282 32,313 17,864 1,811 17,132 1,754 shares in Millions, S in Millions Income Statement Net Sales Cost of sales Gross profit Operating expenses: Selling, general and administrative Depreciation and amortization Impairment loss Total operating expenses Operating income Interest and other income) expense: Interest and investment income Interest expense Other Interest and other, net Earnings before provision for income taxes Provision for income taxes Net earnings 19,513 1,870 247 21,630 15,530 19,675 14,681 18,886 13,427 -93 1,051 -74 1,057 -36 972 16 936 974 14,556 3,435 $11,121 983 13,698 5,068 $8,630 12.491 4,534 $7,957 Additional Information Basic weighted average common shares Cash dividend per share Operating cash flow for the year 1,137 4.12 13,038 1,178 3.56 12,031 1.229 2.76 9,783 Home Depot.xls Balance Sheet Income Statement NOTE:2015 BALANCE SHEET INFORMATION SHOULD BE USED ONLY FOR RATIOS Report Date $1778 $1935 $13925 $ s $1.952 52 538 $2.029 $12.449 2216 $1.890 $11.809 $12.768 $18.529 $22 375 $18.933 $22 075 $2275 $12 $44 529 317.724 $21.914 $2093 $1235 $42.966 $22.191 $2.102 $1,196 341,973 $44.903 $4159 $350 $1.399 $7.755 $1 SOS $556 $1782 3710 $7.000 $1.484 Sin Mons Current assets Cash and cash equivalents Receivables.net Merchandise inventories Other current assets Total current assets Net property and equipment Goodwill Other assets Total assets Current Liabilities: Short-term det Accounts payable Accrued salaries and related expenses Sales taxes payable Deferred revenue Income taxes payable Current installments of long-term debt Other accrued expenses Total current liabilities Long-term deb excluding current installments Deferred income taxes Other long-term liabilities Total liabilities Common stock, par value 50.05, authorized: 10.000 shares issued 1.782 Paid in capital Retained earings Accumulated other comprehensive loss Treasury stock, al cos, 677 shares at February 3, 2019 and 622 shares al Total stockholders' (deficit) equity Total liabilities and stockholders' equity $5,565 $1,515 $475 $1,566 S08 $7264 $1640 $520 $1805 $54 $1.202 $2170 $16114 $2427 $469 $2.174 $43.075 $1.056 $2511 $16716 $26. NOT $491 $1857 $45 881 599 $1057 505423 S772 558 195 3.97 $1.041 $1680 $25 $542 $2.195 $14.133 $2219 5296 $1855 $38.633 $12.524 $20,789 $39 $1.65 $35.657 $10.92 $39.935 $566 54896 $1.454 544529 $9.787 $35,519 07 $40.194 333 2006 $30,973 $898 $33,194 36.316 $41.373 544.003 Additional Information No allowance account is created for receivables, ie. Net receivables is equal to grosse Property and Equipment at cost Land Buildings Furniture. Factures and Equipment Leasehold improvements Construction in Progress Capital Leases Less Accumulated Depreciation and Amortization Net Property and Equipment $18.073 19505 1637 8207 $17.772 11020 1519 1765 10279 739 80 1.169 1512 21 914 1000 17005 22.191 22075 Lowes.xlsx Balance sheet Income Statement As Reported Annual Income Statement Report Date Scale Net sales Cost of sales Gross margin Selling, general & administrative expense Depreciation & amortization Operating income (loss) Interest income (expense), net Loss on extinguishment of debt Pre-tax earnings (losses) Income tax provision Net earnings 2018 Thousands 71,309,000 48,401,000 22,908,000 17,413,000 1,477,000 4,018,000 -624,000 2017 Thousands 68,619,000 45,210,000 23,409,000 15,376,000 1,447,000 6,586,000 -633,000 -464,000 5,489,000 2,042,000 3,447,000 2016 Thousands 65,017,000 42,553,000 22,464,000 15,129,000 1,489,000 5,846,000 -645,000 3,394,000 1,080,000 2,314,000 5,201,000 2,108,000 3,093,000 Additional Information Weighted average shares outstanding - basic Cash dividends per share Net cash flows from operating activities 811,000 1.85 6,193,000 839,000 1.58 5,065,000 880,000 1.33 5,617,000
Step by Step Solution
There are 3 Steps involved in it

Get step-by-step solutions from verified subject matter experts