

Question: Please do that Correctly and Respectively Don't copying from another chegg Thank you Download the dataset PB DATA from D2L. This data represents 30 particle
Please do that Correctly and Respectively Don't copying from another chegg
Thank you
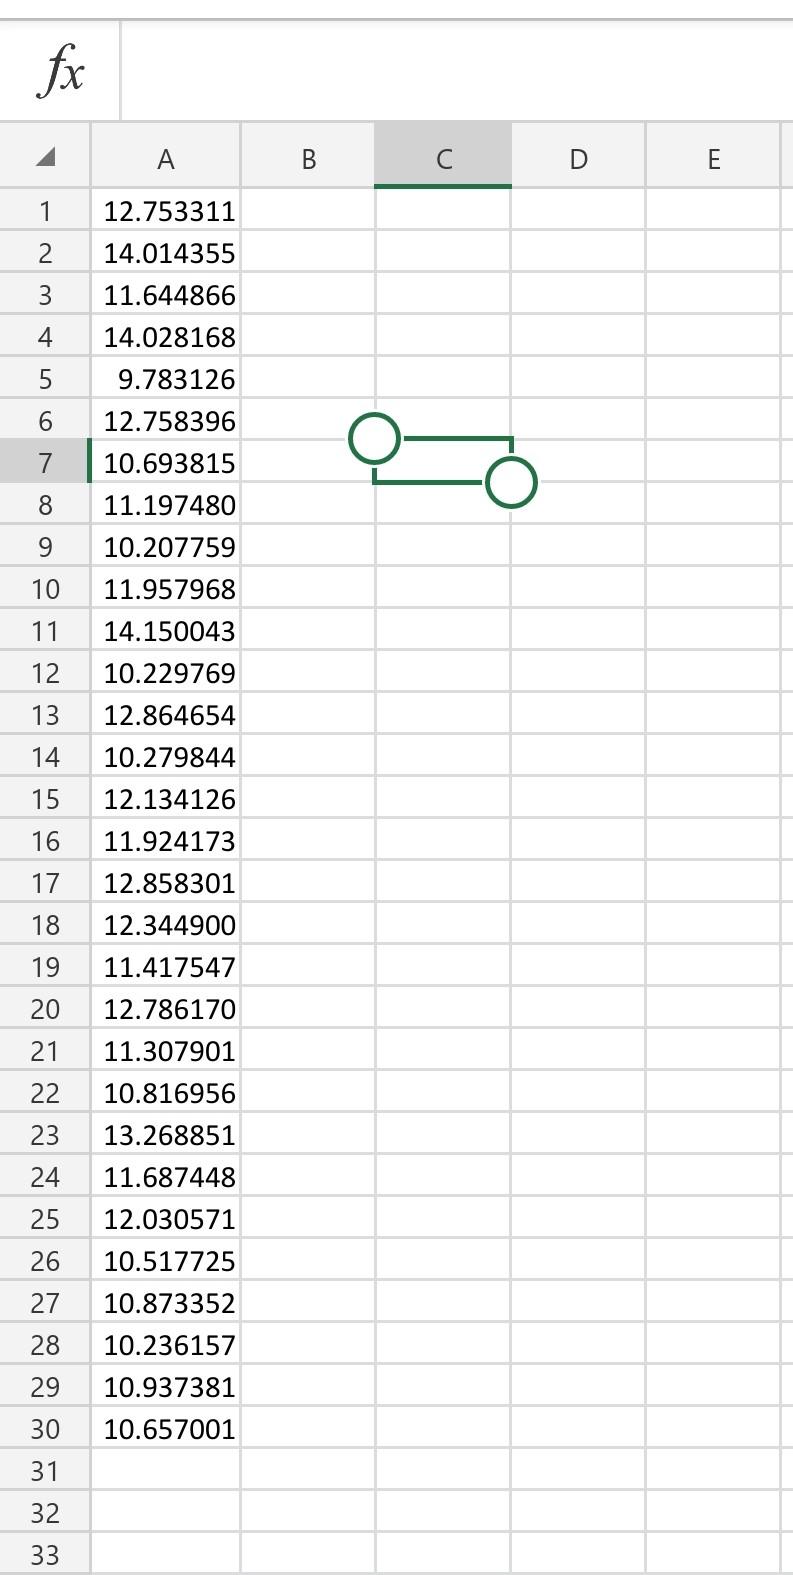
Download the dataset PB DATA from D2L. This data represents 30 particle boards, over 6 days, 5 boards each day and the humidity of the wood during production. [e.g. 6 samples of 5 items each day] Create both an X and an R chart for this data. Be sure to include 30 UCLs and LCLS on your graphs. State if the process is out of control. Use may use any software you like to create this, likewise, you may also just do it by hand. If you chose to use the R packages "qcc" and "SixSima", this is the also the same data set as "ss.data.pb1". Regardless of what software you use, show the calculations of UCL and LCL, do not just show the software's output. Point breakdown (10 total): Correct X chart [3] Correct R chart [3] Correct UCL and LCL [2] UCL and LCL calculations shown [2] fx A B C D E 1 2 3 12.753311 14.014355 11.644866 14.028168 9.783126 12.758396 4 5 6 7 3819 8 9 10 11 12 13 14 15 16 17 18 19 11.197480 10.207759 11.957968 14.150043 10.229769 12.864654 10.279844 12.134126 11.924173 12.858301 12.344900 11.417547 12.786170 11.307901 10.816956 13.268851 11.687448 12.030571 10.517725 10.873352 10.236157 10.937381 10.657001 20 21 22 23 24 25 26 27 28 29 30 31 32 33
Step by Step Solution
There are 3 Steps involved in it

Get step-by-step solutions from verified subject matter experts