

Question: Please do the 5 steps of the hypothesis, which are. Pictures are attached. Analysis was done in 2008. Do the 5 steps of the hypothesis,
Please do the 5 steps of the hypothesis, which are. Pictures are attached. Analysis was done in 2008. Do the 5 steps of the hypothesis, and provide an interpretation from the example below. All information is below!!!! Follow format. Information is there
Follow the six steps of the hypothesis. An example of the six steps of the hypothesis is provided. Note: This analysis is for US Adults and was done in 2008. Please provide this information in your interpretation. The analysis is attached. T-test. Variables are EDUC and DIVORCE. EDUC IS scale.
Questions:
Step 1: State the null hypothesis: Write the null hypothesis (3 pts) and one research/alternate hypothesis (3 pts).
Step 2: Set alpha. What will you set alpha at and why?
Step 3: Select the appropriate test statistic.
a). What is variable name and the level of measurement of each of the variables? Related, how many categories are in the categorical variable(s)?
b). What test statistic will you use to determine if you should reject the null hypothesis?
c.) Why did you select this test statistic? (3 pts)
Step 4 (10 pts) : Analysis is attached. Make sure you have clear titles and data source information included. Data source is General Social Survey. But, provide a title. Ex. Table 1. Occupational prestige by sex of U.S. Adults, 2008
Step 5 (5 pts): Based on the output, make a decision. Is the relationship between the two variables statistically significant? Explain how you arrived at this answer by referencing specific statistics from the output. Ex. .265>.05 so accept Null; not statistically significant; no relationship
[Step 6.] Provide a clear, concise, relevant, accurate and precise (CCRAP) interpretation for a scientific audience.
- Use the appropriate statistical shorthand (ex. t= 3.79, df=1245, p=.002) to support your statements.
- You should clarify if there is a statistically significant relationship between the variables.
- Include in your interpretation a summary of the descriptive data.
- If appropriate, include an interpretation of the post-hoc output.
- Include information in your interpretation that clarifies the population represented by your findings (i.e. U.S. adults in 2008) or reference tables/figures in your response that provide this information. Ex. There was no relationship between gender identity and occupational prestige for U.S. adults in 2008, t=-.480, df=1919, p=.631. Men's occupational prestige score averaged 43.6 (SD=13.6) compared to women's at 43.9 (SD=14.1).
Ex of what to do: Five steps of hypothesis testing applied to this output:
- Step 1: State Null Hypothesis (every null has a research hypothesis associated with it):
Null: There is no relationship between sex and occupational prestige.
OR
Null: There is no difference between men's and women's occupational prestige.
Research: There is a relationship between sex and occupational prestige.
OR
Research: There is a difference between men's and women's occupational prestige.
- Step 2: Set alpha (risk level; significance level; p-value) = .05
- Step 3: Select appropriate test statistic: t-test b/c sex = 2 category categorical variable and occupational prestige is a continuous variable
- Step 4: See attached analysis.
Step 5: Make a decision: p=.631>.05 so ACCEPT Null (or fail to reject Null)
There is not a statistically significant relationship between sex and occupational prestige.
Step 6: INTERPRETATION:
INTERPRETATION:
There was a statistically significant relationship between having a born again experience and socioeconomic index for U.S. adults in 2008, t=5.883, df=1879, p=.000. Adults who had a born again experience had lower socioeconomic index scores on average (M=45.4, SD=18.4) compared to those without a born again experience (M=50.8, SD=19.9).
OR
In 2008, there was a statistically significant difference in socioeconomic index scores for U.S. adults who identified as born again (M=45.4, SD=18.4) compared to those who did not identify as born again (M=50.8, SD=19.9), t=5.883, df=1879, p=.000.
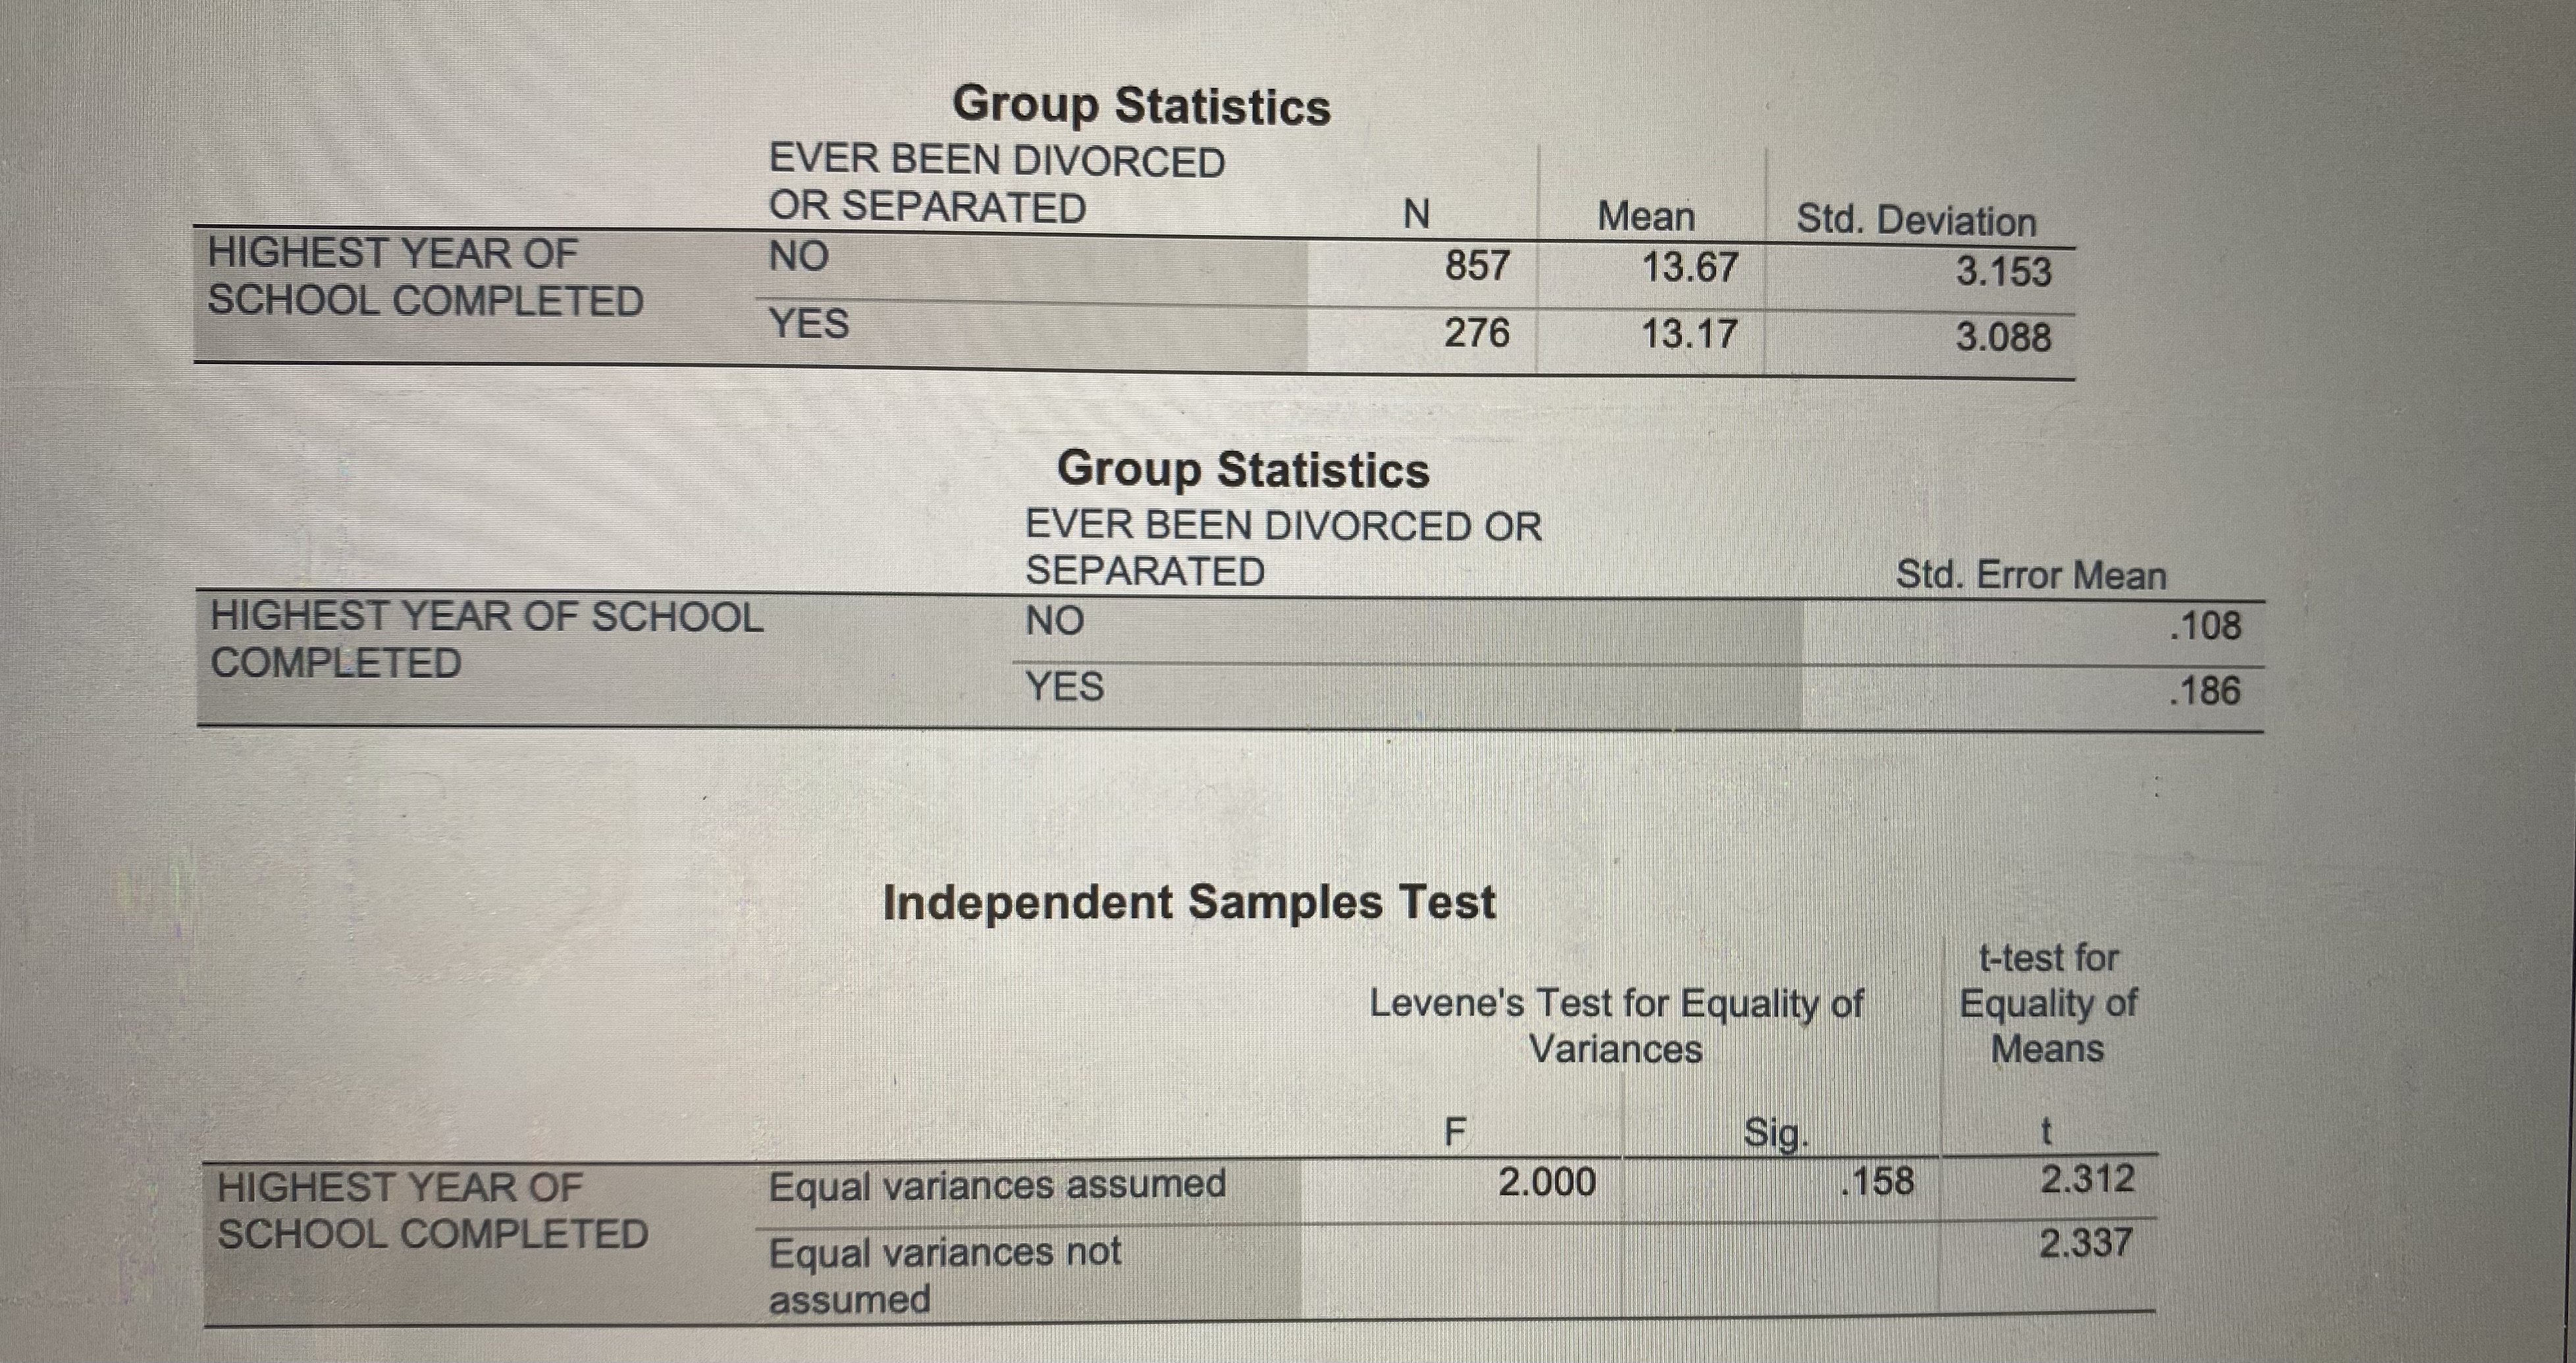
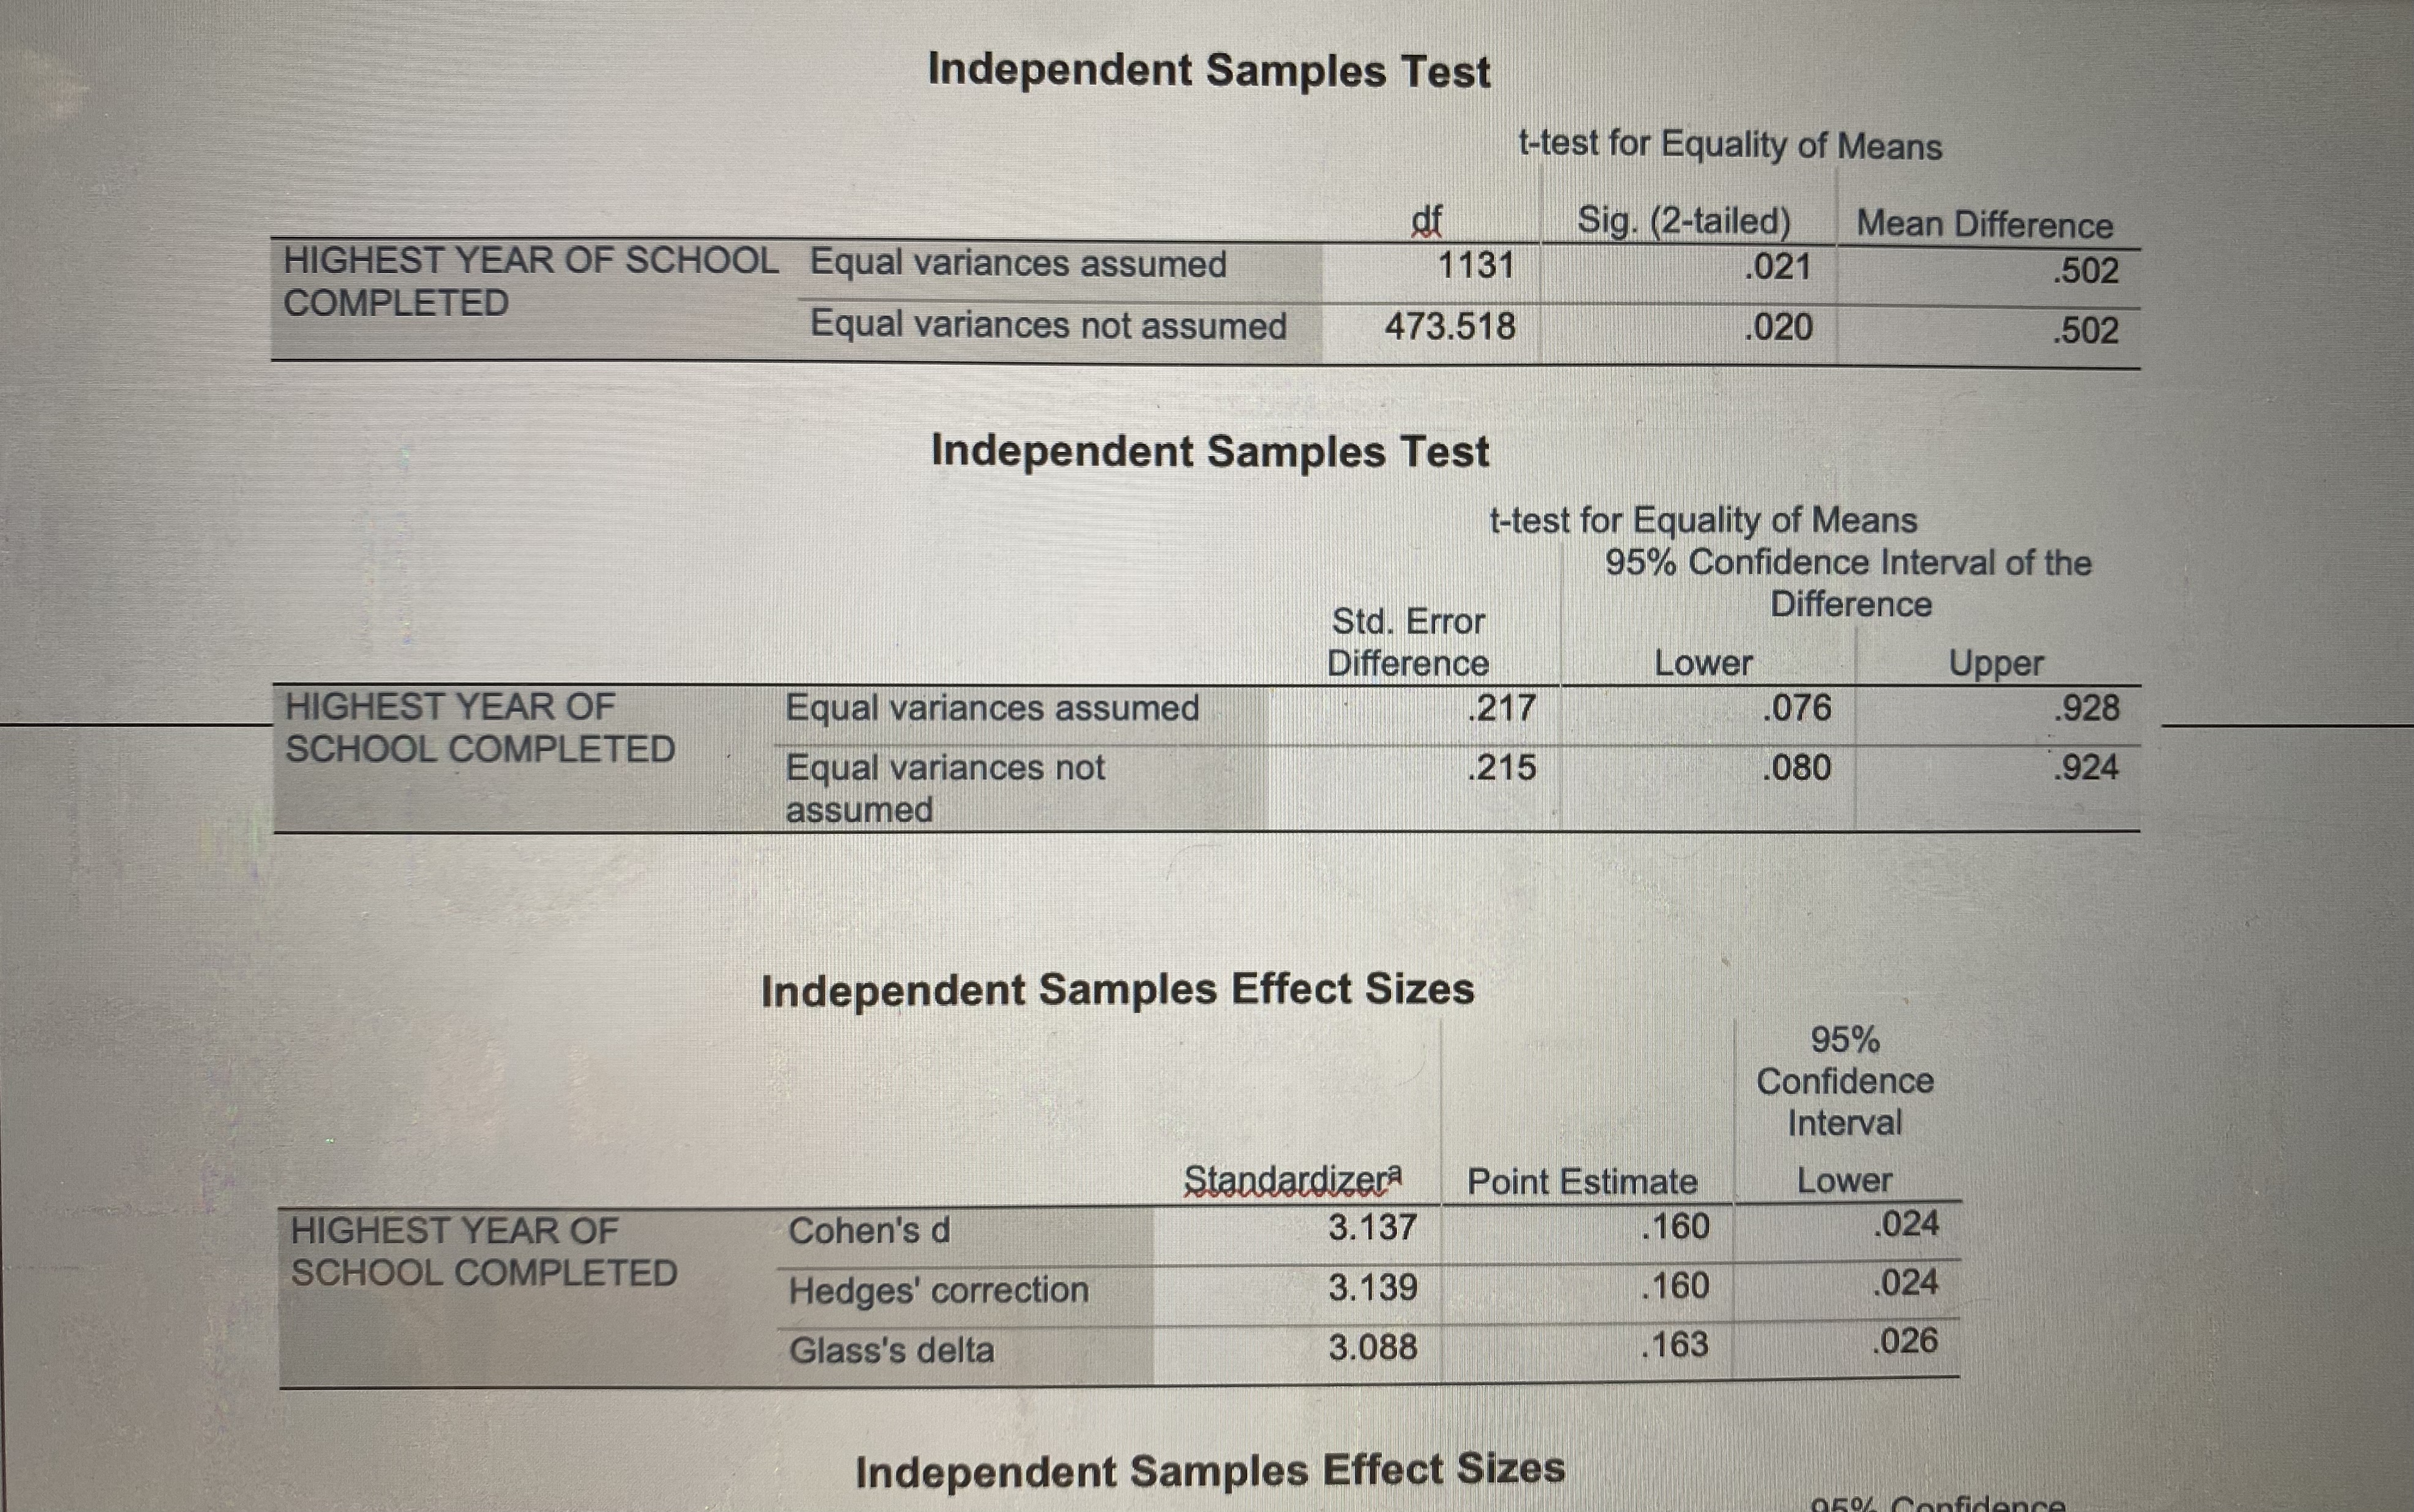
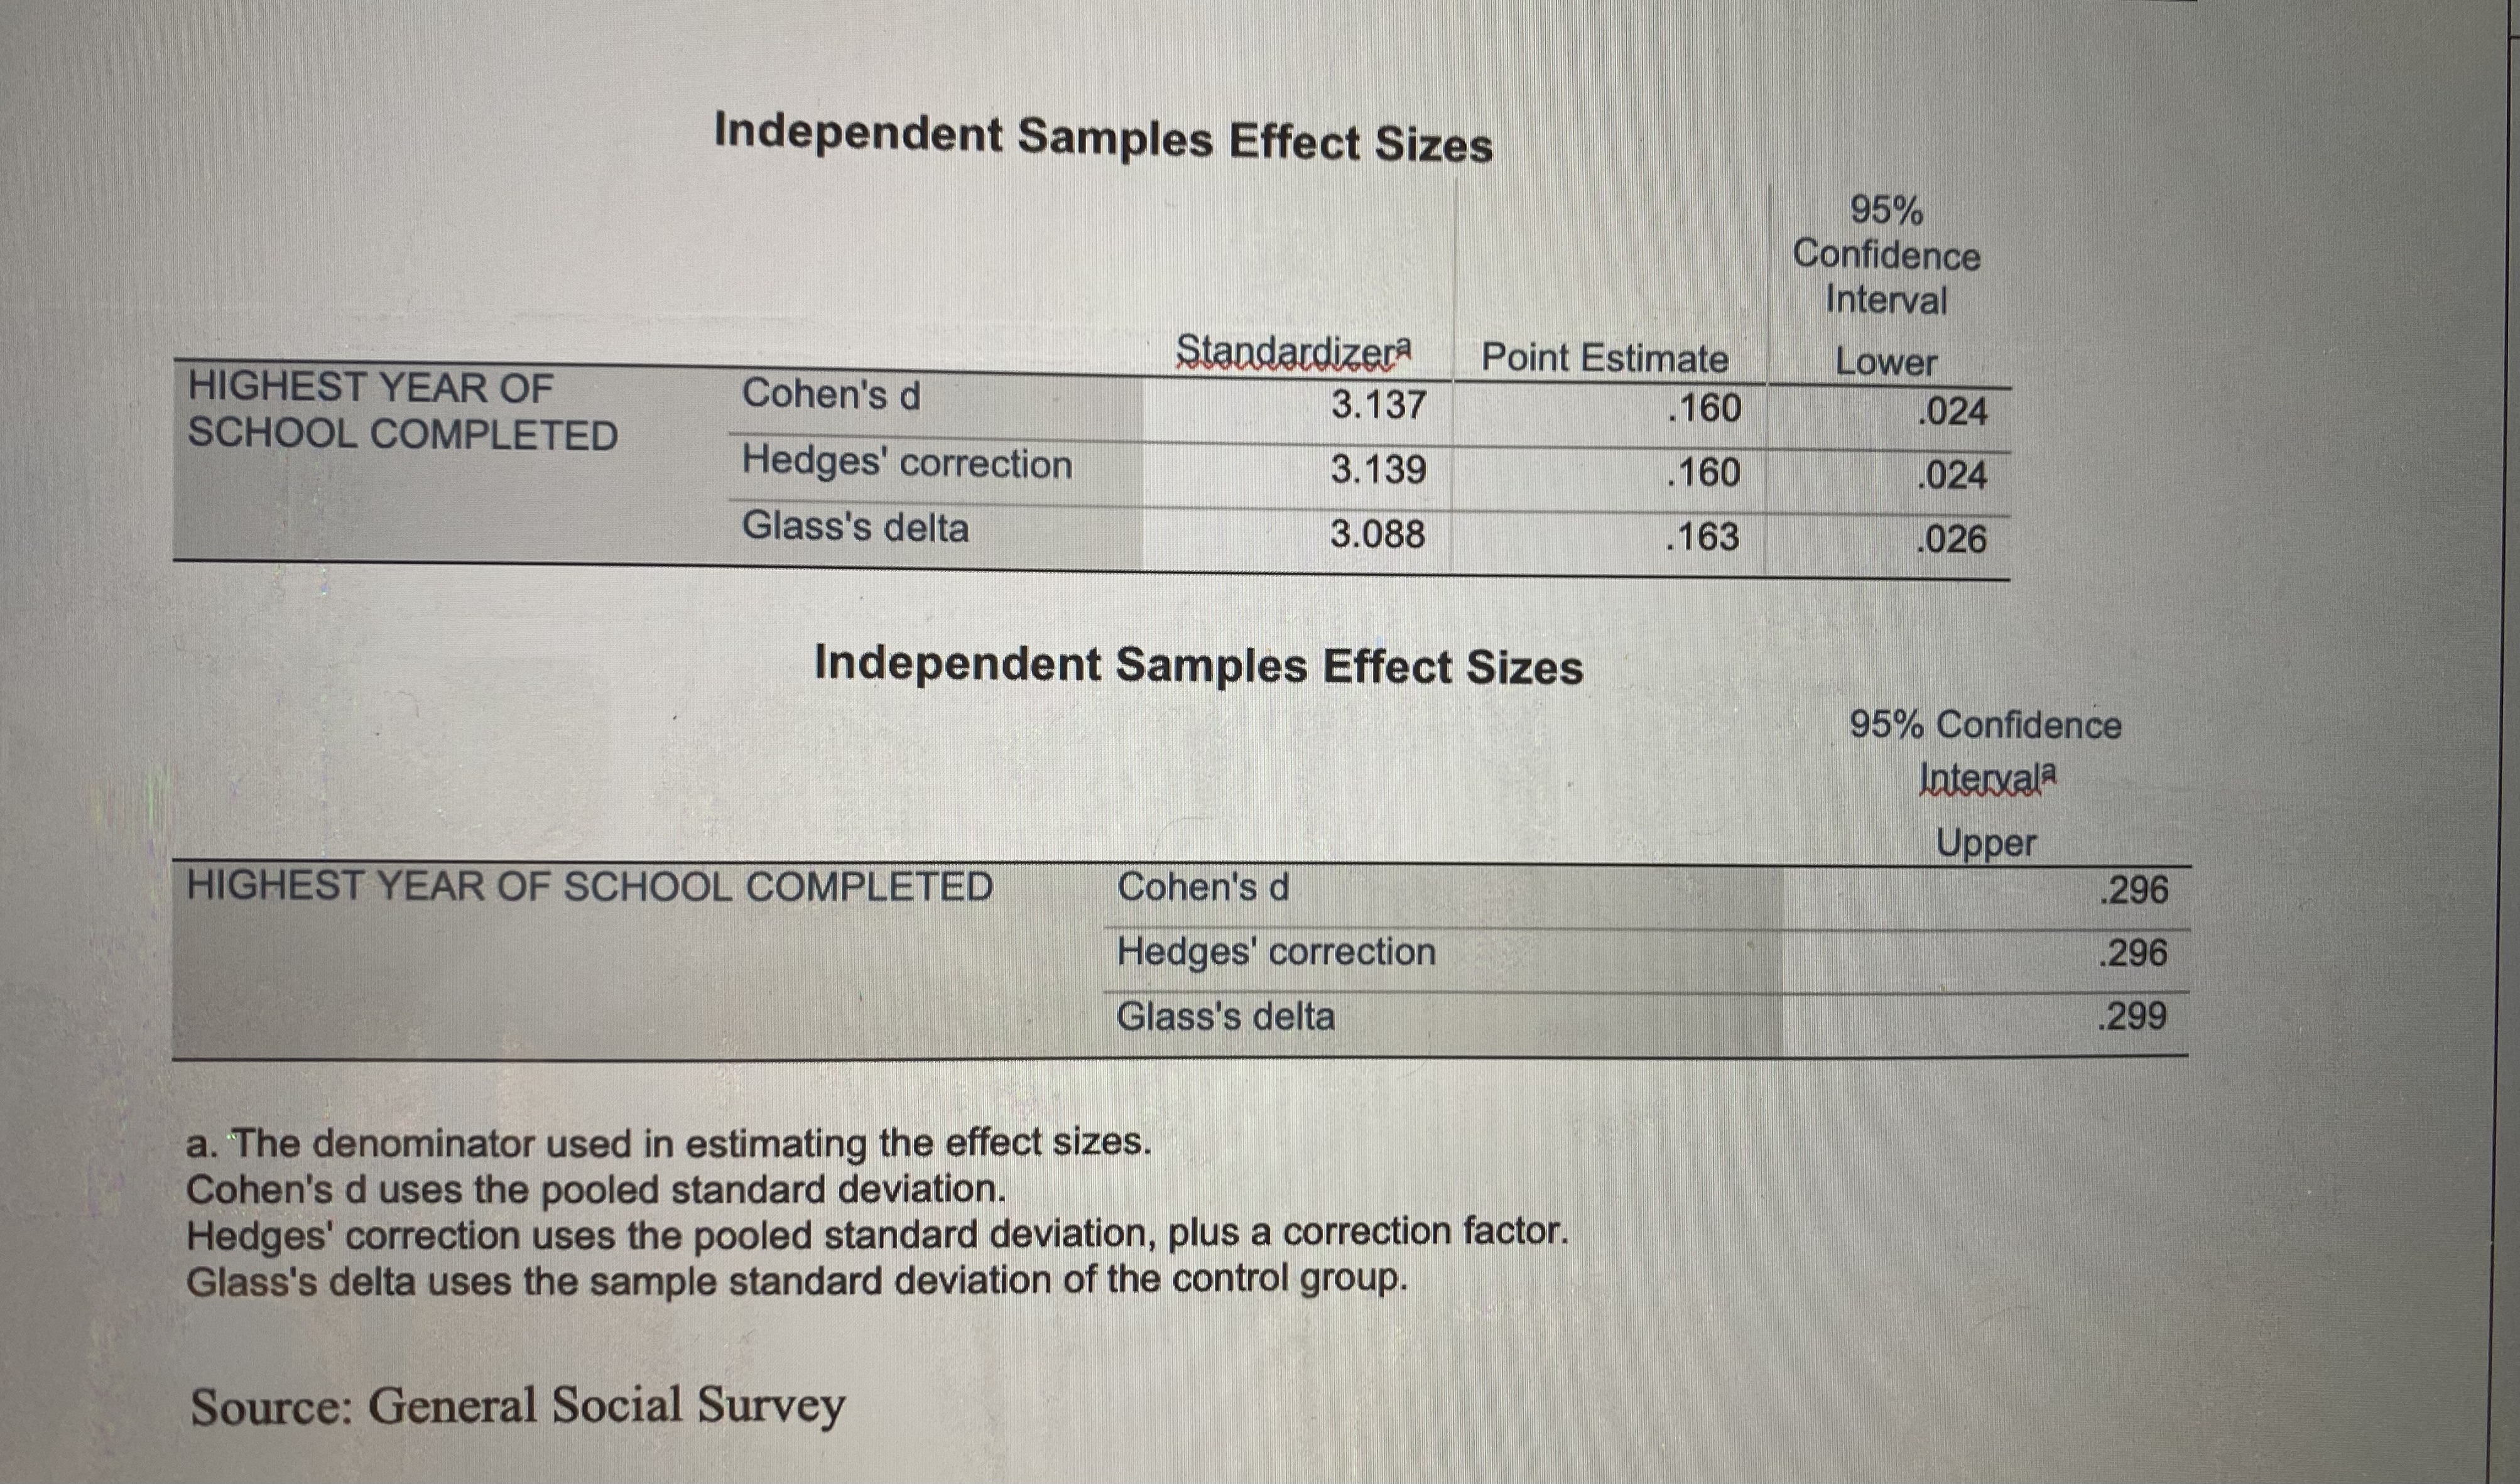
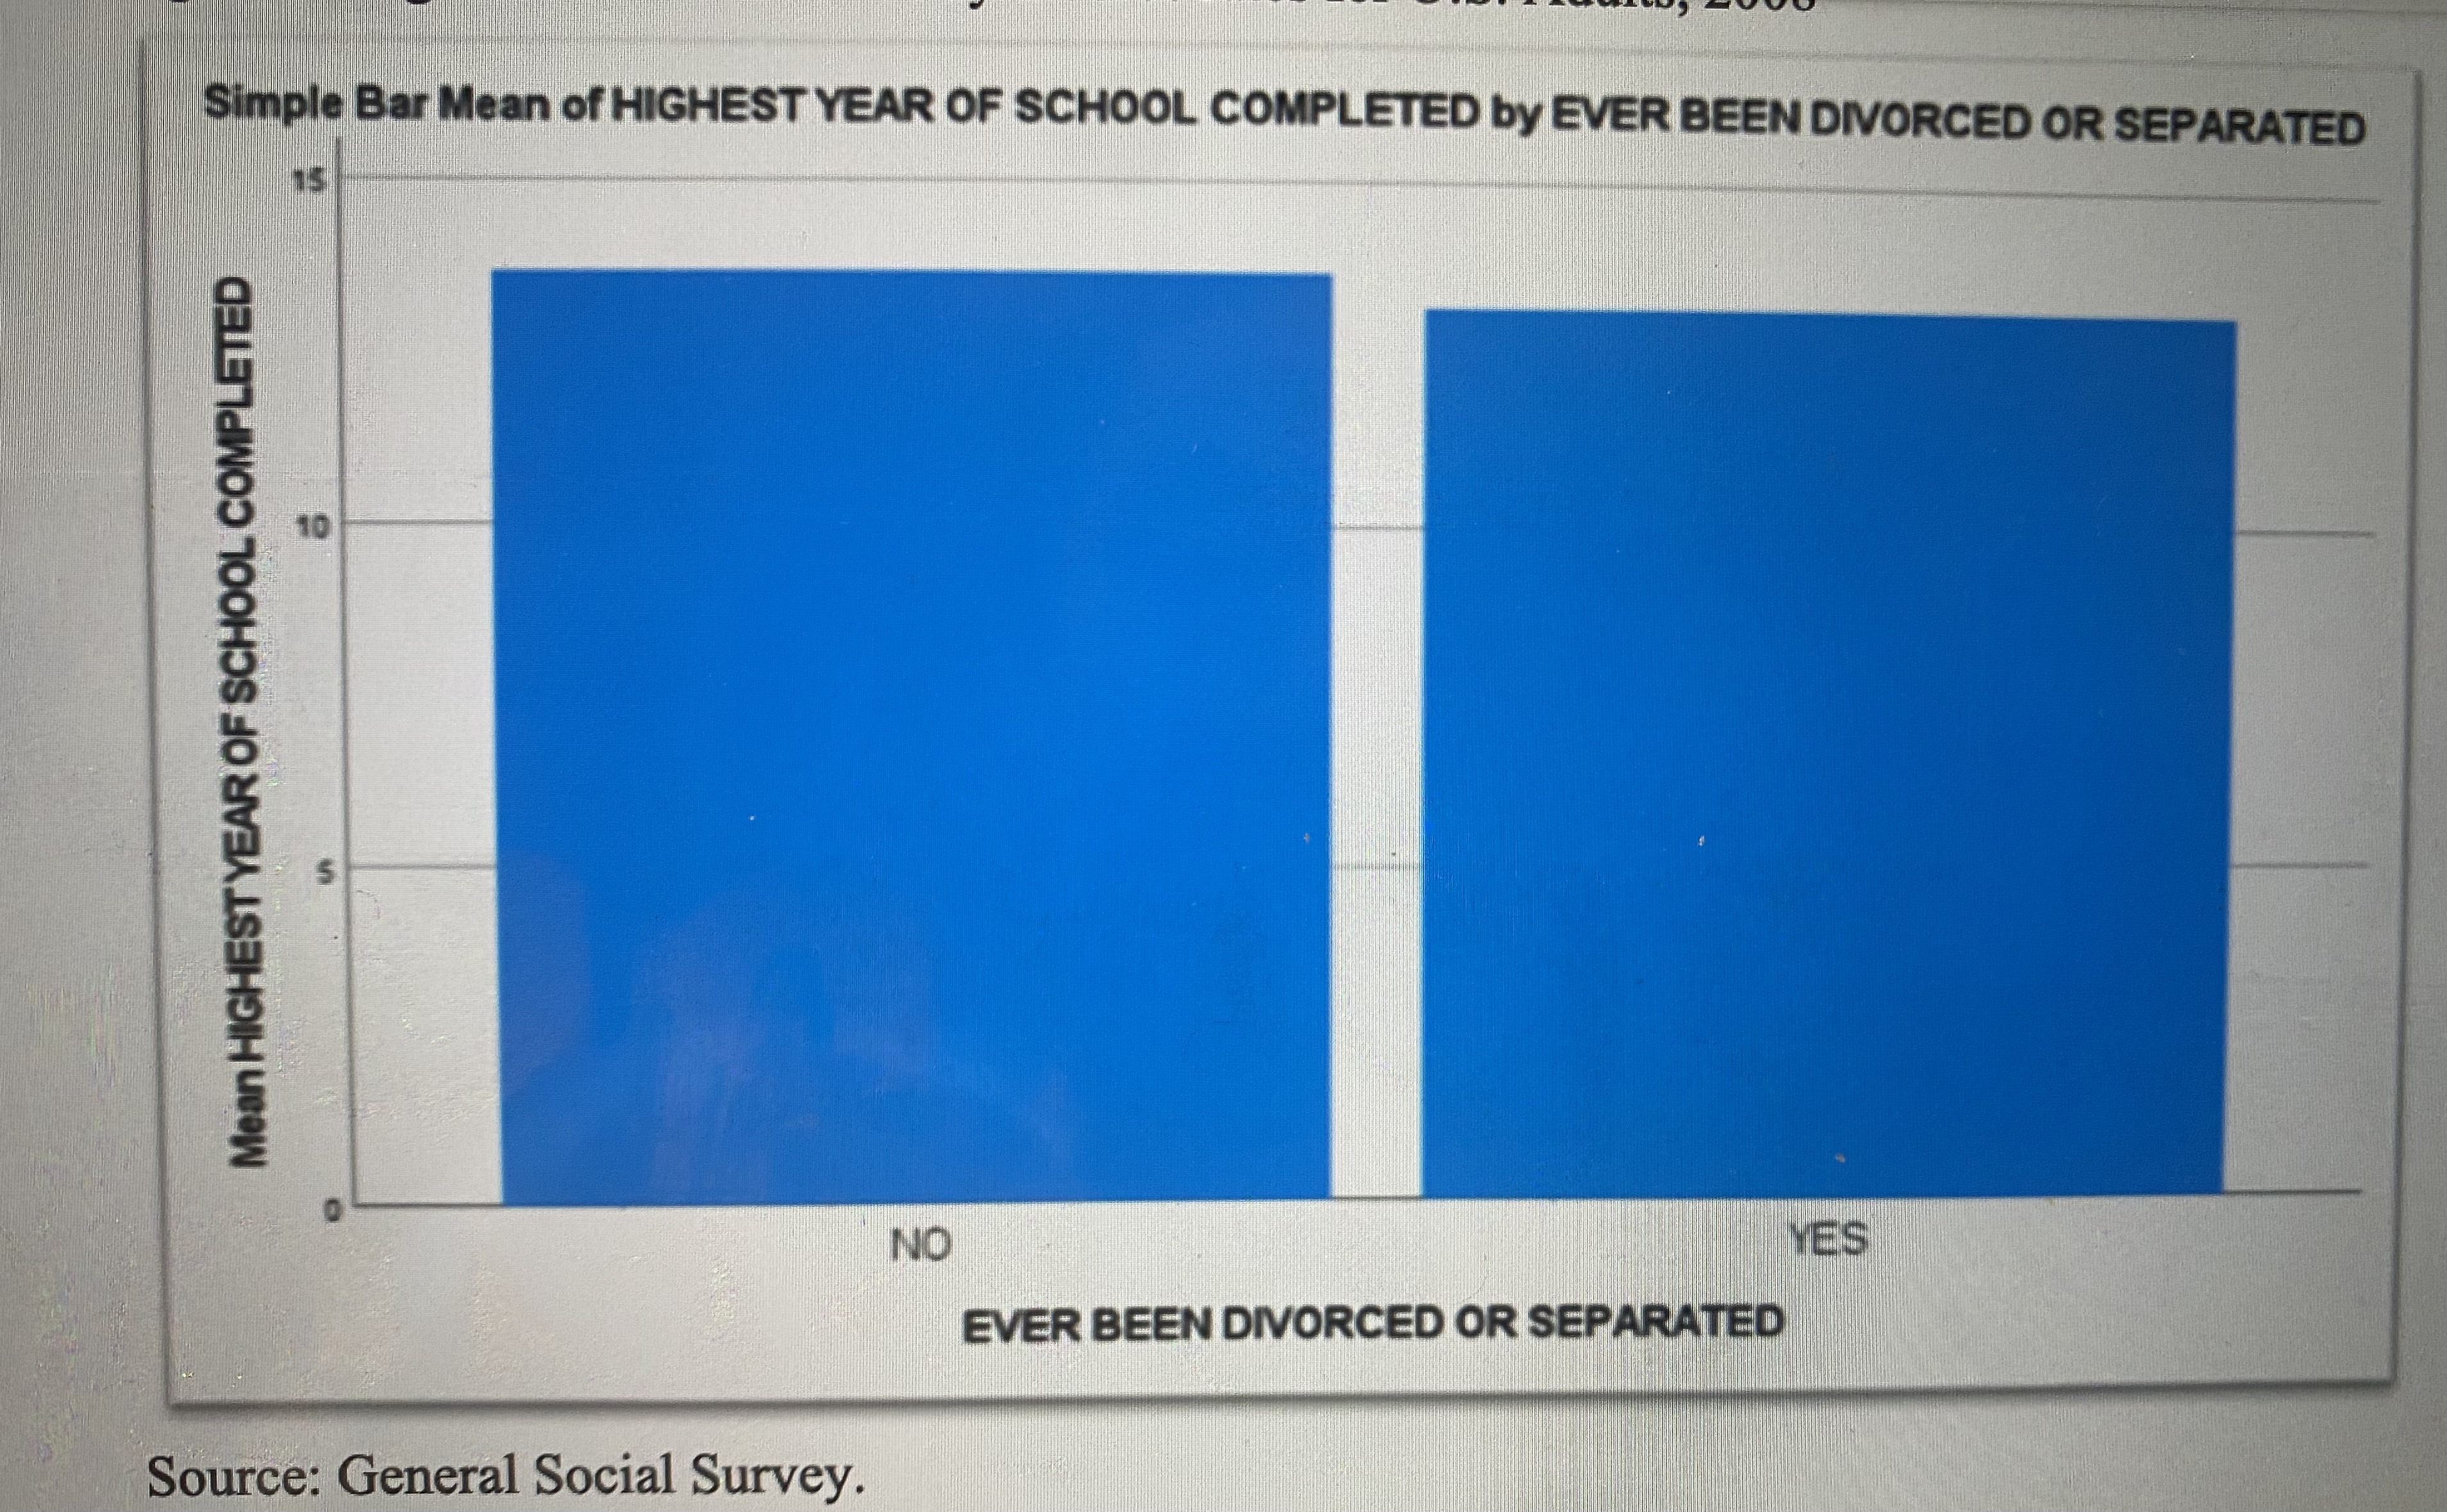
Group Statistics EVER BEEN DIVORCED OR SEPARATED N Mean Std. Deviation HIGHEST YEAR OF NO 857 13.67 3.153 SCHOOL COMPLETED YES 276 13.17 3.088 Group Statistics EVER BEEN DIVORCED OR SEPARATED Std. Error Mean HIGHEST YEAR OF SCHOOL NO .108 COMPLETED YES .186 Independent Samples Test t-test for Levene's Test for Equality of Equality of Variances Means F Sig. HIGHEST YEAR OF Equal variances assumed 2.000 158 2.312 SCHOOL COMPLETED Equal variances not 2.337 assumedIndependent Samples Test t-test for Equality of Means of Sig. (2-tailed) Mean Difference HIGHEST YEAR OF SCHOOL Equal variances assumed 1131 021 502 COMPLETED Equal variances not assumed 473.518 020 502 Independent Samples Test t-test for Equality of Means 95% Confidence Interval of the Std. Error Difference Difference Lower Upper HIGHEST YEAR OF Equal variances assumed 217 076 .928 SCHOOL COMPLETED Equal variances not .215 080 .924 assumed Independent Samples Effect Sizes 95% Confidence Interval Standardizera Point Estimate Lower HIGHEST YEAR OF Cohen's d 3.137 160 024 SCHOOL COMPLETED Hedges' correction 3.139 160 024 Glass's delta 3.088 163 026 Independent Samples Effect SizesIndependent Samples Effect Sizes 95% Confidence Interval Standardizera Point Estimate Lower HIGHEST YEAR OF Cohen's d 3.137 160 024 SCHOOL COMPLETED Hedges' correction 3.139 .160 024 Glass's delta 3.088 163 026 Independent Samples Effect Sizes 95% Confidence Intervala Upper HIGHEST YEAR OF SCHOOL COMPLETED Cohen's d .296 Hedges' correction 296 Glass's delta .299 a. The denominator used in estimating the effect sizes. Cohen's d uses the pooled standard deviation. Hedges' correction uses the pooled standard deviation, plus a correction factor. Glass's delta uses the sample standard deviation of the control group. Source: General Social SurveySimple Bar Mean of HIGHEST YEAR OF SCHOOL COMPLETED by EVER BEEN DIVORCED OR SEPARATED 15 10 Mean HIGHEST YEAR OF SCHOOL COMPLETED NO YES EVER BEEN DIVORCED OR SEPARATED Source: General Social Survey
Step by Step Solution
There are 3 Steps involved in it

Get step-by-step solutions from verified subject matter experts