

Question: please do the dollowing question by using R code satistics Instructions to submit completed HW Assignments into Canvas Complete submission: Includes R code, text output,
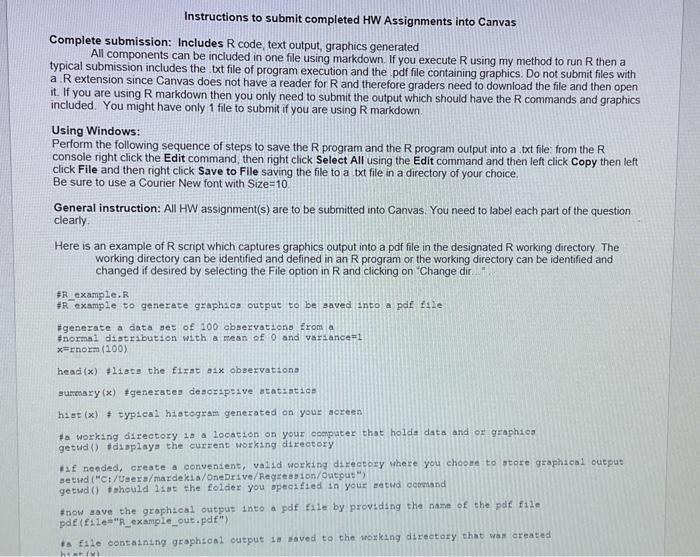
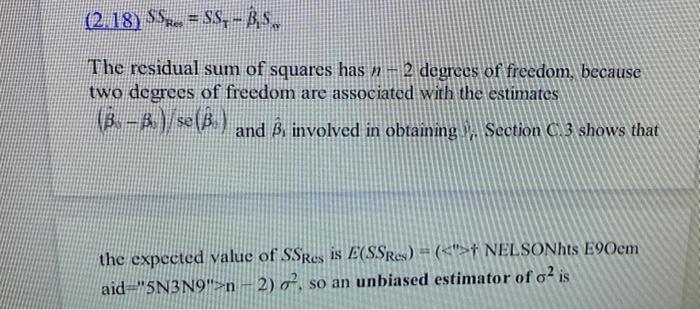
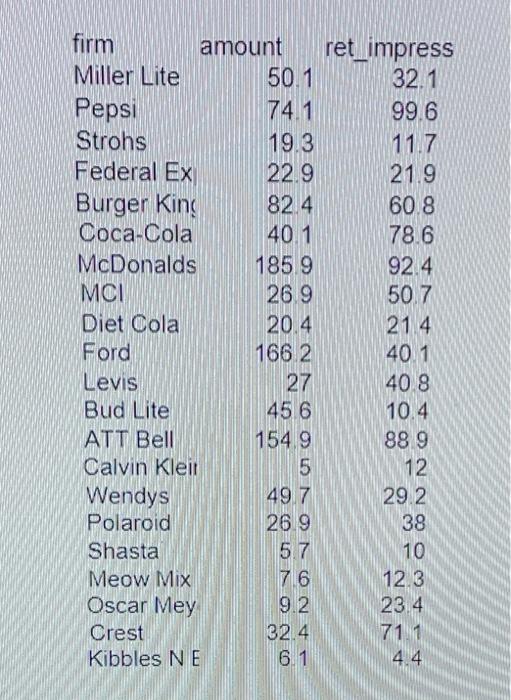
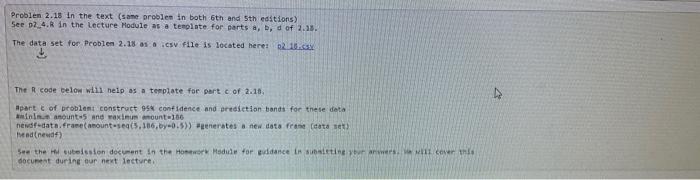
Instructions to submit completed HW Assignments into Canvas Complete submission: Includes R code, text output, graphics generated All components can be included in one file using markdown. If you execute R using my method to run R then a typical submission includes the txt file of program execution and the pdf file containing graphics. Do not submit files with a . R extension since Canvas does not have a reader for R and therefore graders need to download the file and then open it. If you are using R markdown then you only need to submit the output which should have the R commands and graphics included. You might have only 1 file to submit if you are using R markdown. Using Windows: Perform the following sequence of steps to save the R program and the R program output into a txt file: from the R console right click the Edit command, then right click Select All using the Edit command and then left click Copy then left click File and then right click Save to File saving the file to a txt file in a directory of your choice. Be sure to use a Courier New font with Size =10 General instruction: All HW assignment(s) are to be submitted into Canvas. You need to label each part of the question clearly. Here is an example of R script which captures graphics output into a pdf file in the designated R working directory. The working directory can be identified and defined in an R program or the working directory can be identified and changed if desired by selecting the File option in R and clicking on "Change dir.." #R example, R #R example to generate graphics output to be saved into a pdf ille *generate a data set of 100 observations from a #normal distribution with a mean of 0 and variance=1 x=rnorm(100) headi (x) +11aca the firat a1x obsexvationa sumenary (x) fgenerates descriplive atatsatice hist (x) * typ1cal hiatogram generated on youz acreen To working directory is a location on your compater that holda data and or gzaphico getwa() tdisplayg the current working directory HLf needied, create a oonveniene, valid working direcery where you choore to store graphical output setud ("Ct/Ueers/mardekia/Onebrive/ Fegreasion/output") getwd() t mould 11at the folder you bpecifled in your betud command *now aave the graphical output into a pdf file by providing the name of the pol file pdf (file=" "L example_out. pdfin in. (2,18)SSRe=SST1Sm The residual sum of squares has n2 degrees of freedom, because two dogrees of freedom are associated with the estimates (^,)/se(^) and ^1 involved in obtaining Section 23 shows that the expected value of SS Res is E(SSRes)=(t NELSONhts E9Oem aid =5N3N9">n2)2, so an unbiased estimator of 2 is \( \begin{array}{lrr}\text { firm amount } & \text { ret_impress } \\ \text { Miller Lite } & 50.1 & 32.1 \\ \text { Pepsi } & 74.1 & 99.6 \\ \text { Strohs } & 19.3 & 11.7 \\ \text { Federal Ex } & 22.9 & 21.9 \\ \text { Burger Kins } & 82.4 & 60.8 \\ \text { Coca-Cola } & 40.1 & 78.6 \\ \text { McDonalds } & 185.9 & 92.4 \\ \text { MCl } & 26.9 & 50.7 \\ \text { Diet Cola } & 20.4 & 21.4 \\ \text { Ford } & 166.2 & 40.1 \\ \text { Levis } & 27 & 40.8 \\ \text { Bud Lite } & 45.6 & 10.4 \\ \text { ATT Bell } & 154.9 & 88.9 \\ \text { Calvin Kleir } & 5 & 12 \\ \text { Wendys } & 49.7 & 29.2 \\ \text { Polaroid } & 26.9 & 38 \\ \text { Shasta } & 5.7 & 10 \\ \text { Meow Mix } & 7.6 & 12.3 \\ \text { Oscar Mey } & 9.2 & 23.4 \\ \text { Crest } & 32.4 & 71.1 \\ \text { Kibbles NE } & 6.1 & 4.4\end{array} \) See 02.4.k in the Lecture Module as a teeplate for perts a,b, d of 2.28. $ The R code below whil nelp as a terplate foe part c of 2.18, apset e of beoblent construct 95x contidence and grediction bands for these deta aia(nIn.-1 anounto 5 and raxinum anount 166 Mead(newd4) docune of durine gor next leeture. Instructions to submit completed HW Assignments into Canvas Complete submission: Includes R code, text output, graphics generated All components can be included in one file using markdown. If you execute R using my method to run R then a typical submission includes the txt file of program execution and the pdf file containing graphics. Do not submit files with a . R extension since Canvas does not have a reader for R and therefore graders need to download the file and then open it. If you are using R markdown then you only need to submit the output which should have the R commands and graphics included. You might have only 1 file to submit if you are using R markdown. Using Windows: Perform the following sequence of steps to save the R program and the R program output into a txt file: from the R console right click the Edit command, then right click Select All using the Edit command and then left click Copy then left click File and then right click Save to File saving the file to a txt file in a directory of your choice. Be sure to use a Courier New font with Size =10 General instruction: All HW assignment(s) are to be submitted into Canvas. You need to label each part of the question clearly. Here is an example of R script which captures graphics output into a pdf file in the designated R working directory. The working directory can be identified and defined in an R program or the working directory can be identified and changed if desired by selecting the File option in R and clicking on "Change dir.." #R example, R #R example to generate graphics output to be saved into a pdf ille *generate a data set of 100 observations from a #normal distribution with a mean of 0 and variance=1 x=rnorm(100) headi (x) +11aca the firat a1x obsexvationa sumenary (x) fgenerates descriplive atatsatice hist (x) * typ1cal hiatogram generated on youz acreen To working directory is a location on your compater that holda data and or gzaphico getwa() tdisplayg the current working directory HLf needied, create a oonveniene, valid working direcery where you choore to store graphical output setud ("Ct/Ueers/mardekia/Onebrive/ Fegreasion/output") getwd() t mould 11at the folder you bpecifled in your betud command *now aave the graphical output into a pdf file by providing the name of the pol file pdf (file=" "L example_out. pdfin in. (2,18)SSRe=SST1Sm The residual sum of squares has n2 degrees of freedom, because two dogrees of freedom are associated with the estimates (^,)/se(^) and ^1 involved in obtaining Section 23 shows that the expected value of SS Res is E(SSRes)=(t NELSONhts E9Oem aid =5N3N9">n2)2, so an unbiased estimator of 2 is \( \begin{array}{lrr}\text { firm amount } & \text { ret_impress } \\ \text { Miller Lite } & 50.1 & 32.1 \\ \text { Pepsi } & 74.1 & 99.6 \\ \text { Strohs } & 19.3 & 11.7 \\ \text { Federal Ex } & 22.9 & 21.9 \\ \text { Burger Kins } & 82.4 & 60.8 \\ \text { Coca-Cola } & 40.1 & 78.6 \\ \text { McDonalds } & 185.9 & 92.4 \\ \text { MCl } & 26.9 & 50.7 \\ \text { Diet Cola } & 20.4 & 21.4 \\ \text { Ford } & 166.2 & 40.1 \\ \text { Levis } & 27 & 40.8 \\ \text { Bud Lite } & 45.6 & 10.4 \\ \text { ATT Bell } & 154.9 & 88.9 \\ \text { Calvin Kleir } & 5 & 12 \\ \text { Wendys } & 49.7 & 29.2 \\ \text { Polaroid } & 26.9 & 38 \\ \text { Shasta } & 5.7 & 10 \\ \text { Meow Mix } & 7.6 & 12.3 \\ \text { Oscar Mey } & 9.2 & 23.4 \\ \text { Crest } & 32.4 & 71.1 \\ \text { Kibbles NE } & 6.1 & 4.4\end{array} \) See 02.4.k in the Lecture Module as a teeplate for perts a,b, d of 2.28. $ The R code below whil nelp as a terplate foe part c of 2.18, apset e of beoblent construct 95x contidence and grediction bands for these deta aia(nIn.-1 anounto 5 and raxinum anount 166 Mead(newd4) docune of durine gor next leeture
Step by Step Solution
There are 3 Steps involved in it

Get step-by-step solutions from verified subject matter experts