

Question: Please do the following work and be prepared to submit it in person by the due date. ( 2 0 pts total ) 1 .
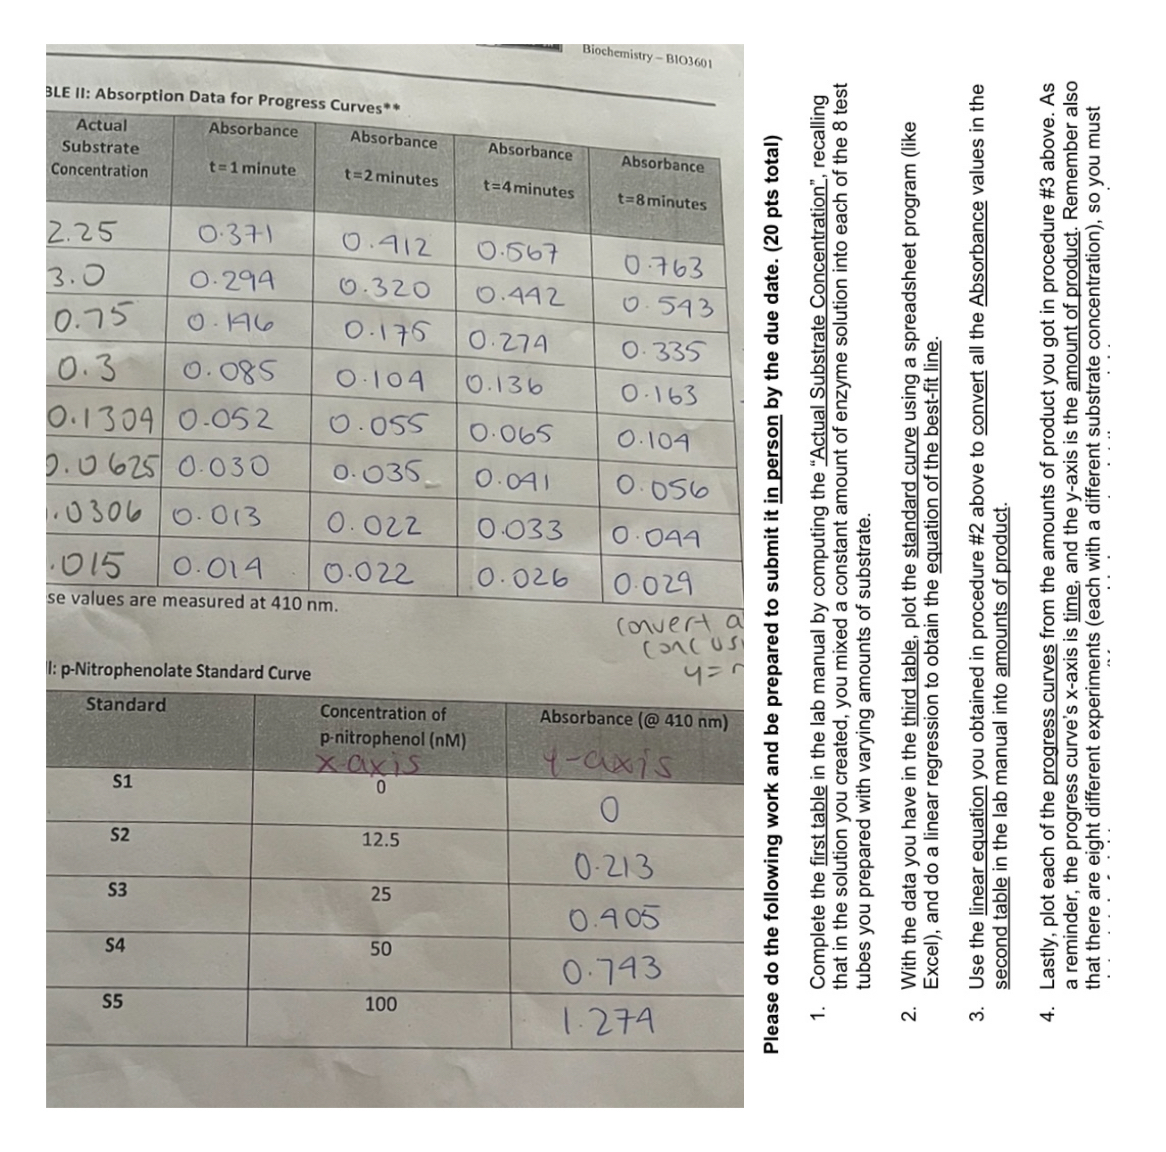
Please do the following work and be prepared to submit it in person by the due date. pts total Complete the first table in the lab manual by computing the "Actual Substrate Concentration", recalling that in the solution you created, you mixed a constant amount of enzyme solution into each of the test tubes you prepared with varying amounts of substrate With the data you have in the third table, plot the standard curve using a spreadsheet program like Excel and do a linear regression to obtain the equation of the bestfit line Use the linear equation you obtained in procedure # above to convert all the Absorbance values in the second table in the lab manual into amounts of product Lastly, plot each of the progress curves from the amounts of product you got in procedure # above. As a reminder, the progress curve's xaxis is time, and the yaxis is the amount of product. Remember also that there are eight different experiments each with a different substrate concentration so you must plot a total of eight progress curves. You could choose to plot these eight progress curves in one graph, or in eight separate graphsit is up to you.
Step by Step Solution
There are 3 Steps involved in it
1 Expert Approved Answer
Step: 1 Unlock

Question Has Been Solved by an Expert!
Get step-by-step solutions from verified subject matter experts
Step: 2 Unlock
Step: 3 Unlock