

Question: please do this in excel and explain how you did it on excel step by step please Excrcise 3 A. Which speciffc combination wonld deliver
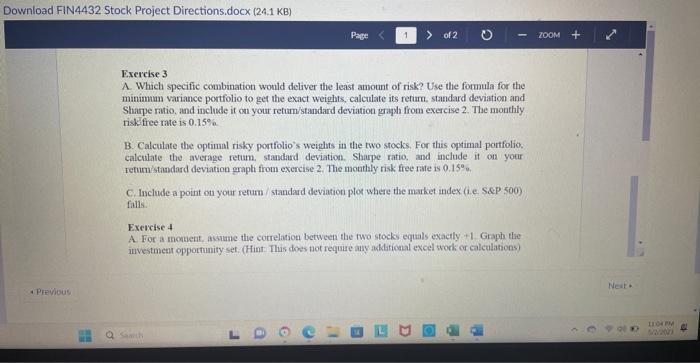

Excrcise 3 A. Which speciffc combination wonld deliver the least amount of risk? Use the formula for the minimum variance portfolio to get the exact weights, calculate its retum, standard deviation and Sharpe ratio, and include it on your retum/standard deviation graph from exercise 2. The monthly risk free rate is 0.15% B. Calculate the optimal risky portfolio's weights in the two stocks. For this optimal portfolio. calculate the average retum. standard deviation. Shape ratio, and include it on your refum'standard deviation graph from exercise 2. The mouthly risk free rate is 0.15%o, C. Include a point on your refurn/standard deviation plor where the market index (ie. SEP S00) fills. Exercise 4 A For a monaent, assane the correlation between the fwo stocks equals exactly +1 . Graph the investment opportunity set. (Hint: This does not require any adklitional excel work or calculations) Excrcise 3 A. Which speciffc combination wonld deliver the least amount of risk? Use the formula for the minimum variance portfolio to get the exact weights, calculate its retum, standard deviation and Sharpe ratio, and include it on your retum/standard deviation graph from exercise 2. The monthly risk free rate is 0.15% B. Calculate the optimal risky portfolio's weights in the two stocks. For this optimal portfolio. calculate the average retum. standard deviation. Shape ratio, and include it on your refum'standard deviation graph from exercise 2. The mouthly risk free rate is 0.15%o, C. Include a point on your refurn/standard deviation plor where the market index (ie. SEP S00) fills. Exercise 4 A For a monaent, assane the correlation between the fwo stocks equals exactly +1 . Graph the investment opportunity set. (Hint: This does not require any adklitional excel work or calculations)
Step by Step Solution
There are 3 Steps involved in it

Get step-by-step solutions from verified subject matter experts