

Question: Please do up to 13 for the 3 week Moving average and the 5 week Starbucks has a large, global supply chain that must efficiently
Please do up to 13 for the 3 week Moving average and the 5 week
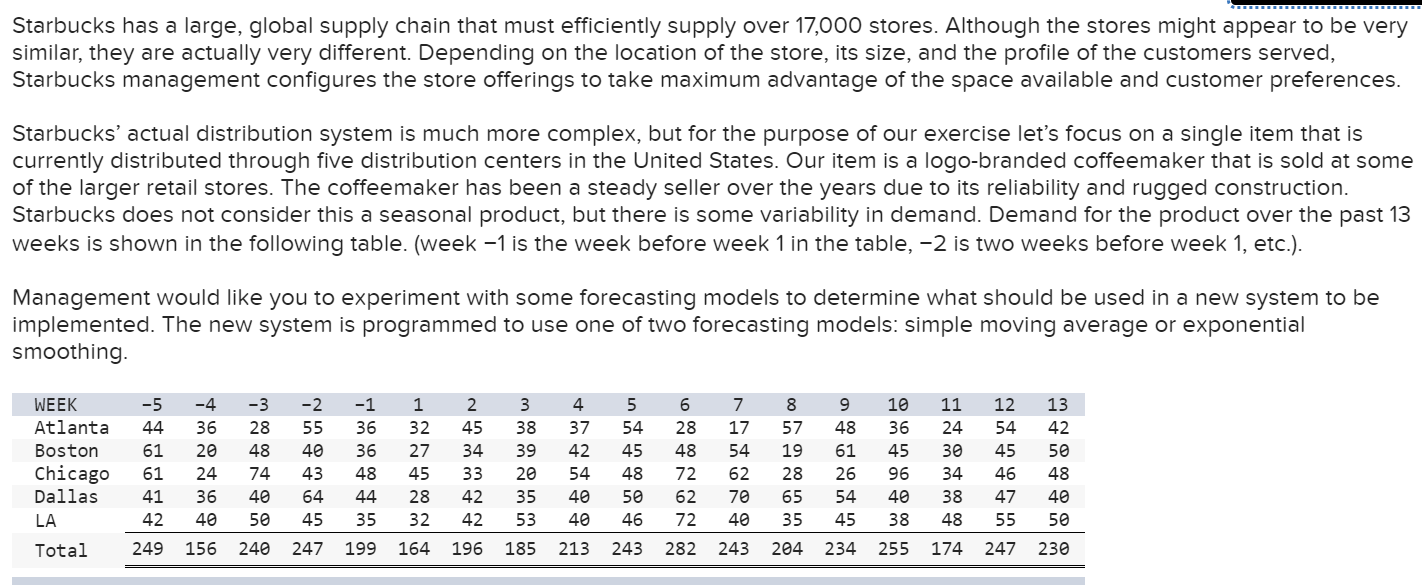
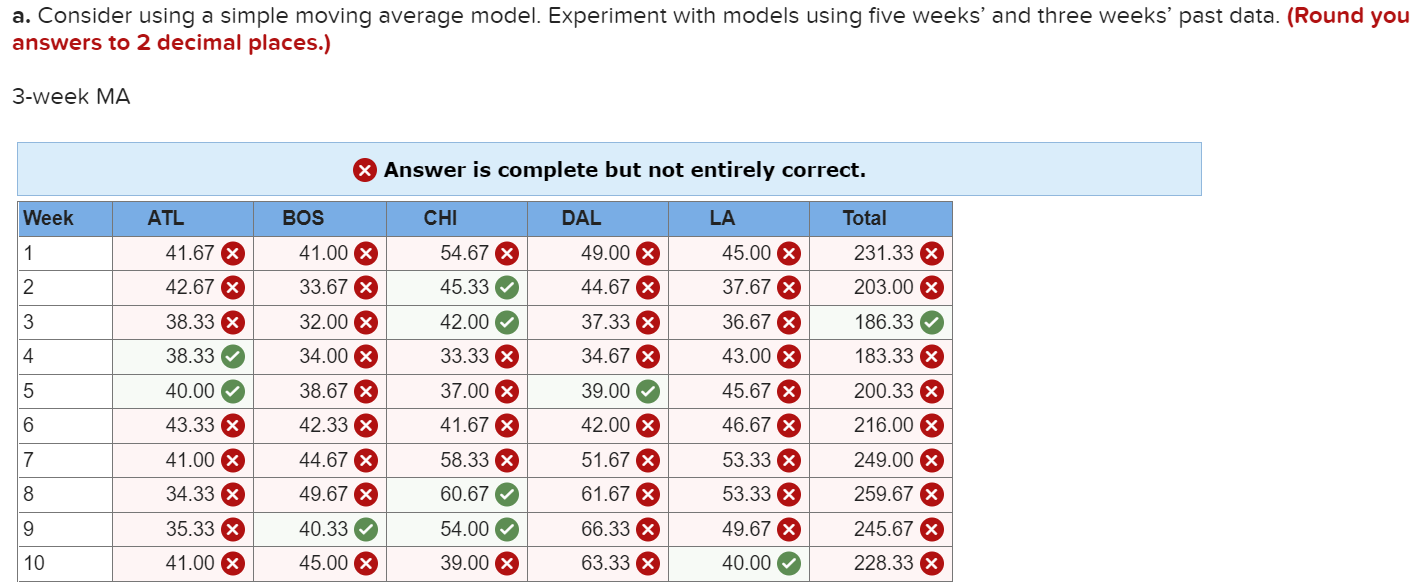
Starbucks has a large, global supply chain that must efficiently supply over 17,000 stores. Although the stores might appear to be very similar, they are actually very different. Depending on the location of the store, its size, and the profile of the customers served, Starbucks management configures the store offerings to take maximum advantage of the space available and customer preferences. Starbucks' actual distribution system is much more complex, but for the purpose of our exercise let's focus on a single item that is currently distributed through five distribution centers in the United States. Our item is a logo-branded coffeemaker that is sold at some of the larger retail stores. The coffeemaker has been a steady seller over the years due to its reliability and rugged construction. Starbucks does not consider this a seasonal product, but there is some variability in demand. Demand for the product over the past 13 weeks is shown in the following table. (week 1 is the week before week 1 in the table, -2 is two weeks before week 1, etc.). Management would like you to experiment with some forecasting models to determine what should be used in a new system to be implemented. The new system is programmed to use one of two forecasting models: simple moving average or exponential smoothing. 4 7 WEEK Atlanta Boston Chicago Dallas LA -5 44 61 61 41 42 249 -4 36 20 24 36 40 -3 28 48 74 -2 55 40 43 64 45 -1 36 36 48 44 35 1 32 27 45 28 32 2 45 34 33 42 42 3 38 39 20 35 53 37 42 54 40 40 5 54 45 48 68%aw 48 72 62 72 7 17 54 62 70 40 243 8 57 19 28 65 35 9 48 61 26 54 45 10 36 45 96 40 38 11 24 30 34 38 48 174 12 54 45 46 47 55 13 42 50 48 40 50 40 50 46 50 Total 156 240 247 199 164 196 185 213 243 282 204 234 255 247 230 a. Consider using a simple moving average model. Experiment with models using five weeks' and three weeks' past data. (Round you answers to 2 decimal places.) 3-week MA & Answer is complete but not entirely correct. Week ATL BOS CHI LA Total DAL 49.00 X 41.67 X 41.00 X 54.67 X 45.00 X 231.33 X 2 42.67 X 33.67 X 45.33 44.67 X 37.67 X 203.00 X 3 38.33 X 32.00 x 42.00 37.33 X 36.67 X 186.33 183.33 X 4 38.33 34.00 X 33.33 X 34.67 X 43.00 X 00 00 WN - 5 40.00 38.67 X 37.00 X 45.67 X 39.00 42.00 X 200.33 X 216.00 X 6 43.33 X 42.33 X 41.67 X 46.67 X 7 41.00 X 44.67 X 58.33 X 51.67 X 53.33 X 249.00 X 8 34.33 X 49.67 X 60.67 61.67 X 53.33 X 259.67 X 9 35.33 X 40.33 54.00 66.33 X 49.67 X 245.67 X 228.33 X 10 41.00 x 45.00 X 39.00 X 63.33 X 40.00 Starbucks has a large, global supply chain that must efficiently supply over 17,000 stores. Although the stores might appear to be very similar, they are actually very different. Depending on the location of the store, its size, and the profile of the customers served, Starbucks management configures the store offerings to take maximum advantage of the space available and customer preferences. Starbucks' actual distribution system is much more complex, but for the purpose of our exercise let's focus on a single item that is currently distributed through five distribution centers in the United States. Our item is a logo-branded coffeemaker that is sold at some of the larger retail stores. The coffeemaker has been a steady seller over the years due to its reliability and rugged construction. Starbucks does not consider this a seasonal product, but there is some variability in demand. Demand for the product over the past 13 weeks is shown in the following table. (week 1 is the week before week 1 in the table, -2 is two weeks before week 1, etc.). Management would like you to experiment with some forecasting models to determine what should be used in a new system to be implemented. The new system is programmed to use one of two forecasting models: simple moving average or exponential smoothing. 4 7 WEEK Atlanta Boston Chicago Dallas LA -5 44 61 61 41 42 249 -4 36 20 24 36 40 -3 28 48 74 -2 55 40 43 64 45 -1 36 36 48 44 35 1 32 27 45 28 32 2 45 34 33 42 42 3 38 39 20 35 53 37 42 54 40 40 5 54 45 48 68%aw 48 72 62 72 7 17 54 62 70 40 243 8 57 19 28 65 35 9 48 61 26 54 45 10 36 45 96 40 38 11 24 30 34 38 48 174 12 54 45 46 47 55 13 42 50 48 40 50 40 50 46 50 Total 156 240 247 199 164 196 185 213 243 282 204 234 255 247 230 a. Consider using a simple moving average model. Experiment with models using five weeks' and three weeks' past data. (Round you answers to 2 decimal places.) 3-week MA & Answer is complete but not entirely correct. Week ATL BOS CHI LA Total DAL 49.00 X 41.67 X 41.00 X 54.67 X 45.00 X 231.33 X 2 42.67 X 33.67 X 45.33 44.67 X 37.67 X 203.00 X 3 38.33 X 32.00 x 42.00 37.33 X 36.67 X 186.33 183.33 X 4 38.33 34.00 X 33.33 X 34.67 X 43.00 X 00 00 WN - 5 40.00 38.67 X 37.00 X 45.67 X 39.00 42.00 X 200.33 X 216.00 X 6 43.33 X 42.33 X 41.67 X 46.67 X 7 41.00 X 44.67 X 58.33 X 51.67 X 53.33 X 249.00 X 8 34.33 X 49.67 X 60.67 61.67 X 53.33 X 259.67 X 9 35.33 X 40.33 54.00 66.33 X 49.67 X 245.67 X 228.33 X 10 41.00 x 45.00 X 39.00 X 63.33 X 40.00Step by Step Solution
There are 3 Steps involved in it
1 Expert Approved Answer
Step: 1 Unlock

Question Has Been Solved by an Expert!
Get step-by-step solutions from verified subject matter experts
Step: 2 Unlock
Step: 3 Unlock