

Question: Please don't attempt if you can not write a MATLAB PROGRAM. I don't need numerical physics solution, I need MATLAB code. Read the question carefully
Please don't attempt if you can not write a MATLAB PROGRAM. I don't need numerical physics solution, I need MATLAB code. Read the question carefully
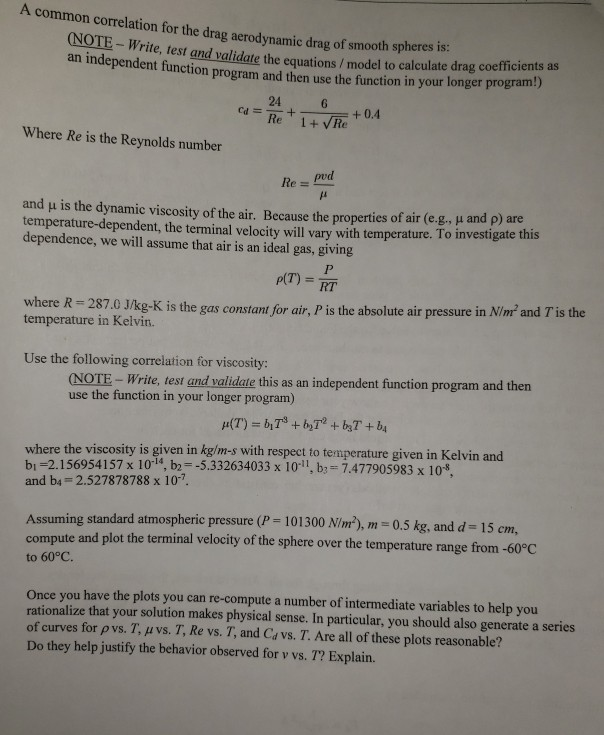
2) Falling Drops Imagine a solid sphere of diameter, d, falling through the air. After its release, the sphere accelerates until it reaches its terminal velocity. The terminal velocity is obtained when the drag force due to air friction, Fa, balances the weight of the sphere, W. The weight of the sphere is simply its mass, m, times acceleration due to gravity (g- 9.8 m/s2), and the drag force can be computed as where Cd is a dimensionless empirical drag coefficient, p is the density of the air, v is the veloci the sphere, and A *d2/4 is the frontal area of the falling sphere. ty of 1 of 4 A common correlation for the drag aerodynamic drag of smooth spheres is NOTE- write, test and validate the equations / model to calculate drag coefficients as ndependent function program and then use the function in your longer program!) 24 +0.4 Where Re is the Reynolds number Re- pud and is the dynamic viscosity of the air. Because the properties of air (eg, and p) are temperature-dependent, the terminal velocity will vary with temperature. To investigate this dependence, we will assume that air is an ideal gas, giving RT where R 287.0 J/kg-K is the gas constant for air, P is the absolute air pressure in Nin and 7 temperature in Kelvin. Use the following correlation for viscosity: NOTE- Write, test and validate this as an independent function program and then use the function in your longer program) where the viscosity is given in kg/m-s with respect to temperature given in Kelv bi-2.156954157 x 10⁻¹⁴, b -5.332634033 x 10-l, b3 7.477905983 x 10⁸, and b4 2.527878788 x 10⁷ in and Assuming standard atmospherie pressure (P- 101300 Nim'), m -0.5 kg, and d 15 cm, compute and plot the terminal velocity of the sphere over the temperature range from -60C to 60C Once you have the plots you can re-compute a number of intermediate variables to help you rationalize that your solution makes physical sense. In particular, you should also generate a series of curves for vs. T, vs. T, Re vs. T, and Cd vs. T. Are all of these plots reasonable? Do they help justify the behavior observed for v vs. T? Explain
Step by Step Solution
There are 3 Steps involved in it

Get step-by-step solutions from verified subject matter experts