

Question: Please don't solve it in excel and give detailed solution. The following table shows the demand of a certain service part over the past eight
Please don't solve it in excel and give detailed solution.
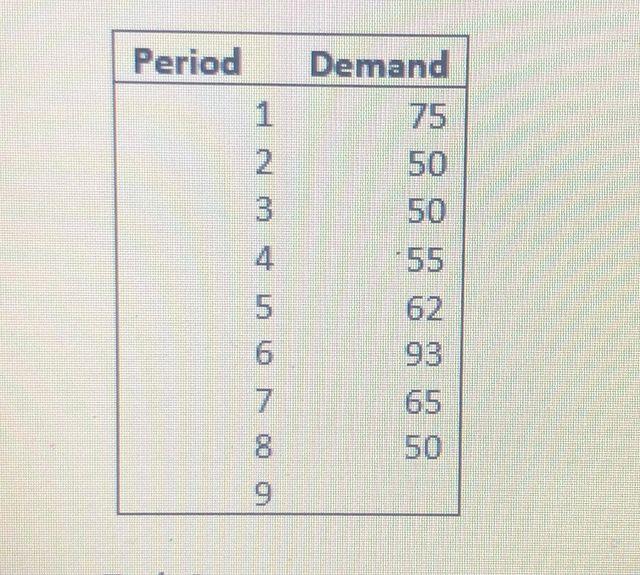
The following table shows the demand of a certain service part over the past eight quarters. Determine the forecasts for quarters 3 to 9 using 2 period moving averages (MA-2) and Exponential smoothing with = 0.3 (ES (0.3)). For ES (0.3) calculations, assume nave forecast for period 2. Compare MAD, MSE and MAPE of the MA-2 and ES (0.3) forecasts for quarters 3 to 8. Which forecasting method has been more accurate?
Step by Step Solution
There are 3 Steps involved in it
1 Expert Approved Answer
Step: 1 Unlock

Question Has Been Solved by an Expert!
Get step-by-step solutions from verified subject matter experts
Step: 2 Unlock
Step: 3 Unlock