

Question: PLEASE DP R-STUDIO PLEASE DP R- STUDIO PLEASE DP R-STUDIO PLEASE DP R-STUDIO PLEASE DP R-STUDIO V PLEASE P R-STUDIO PLEASE DP R-STUDIOPLEASE DP R-STUDIO
 PLEASE DP R-STUDIO PLEASE DP R-
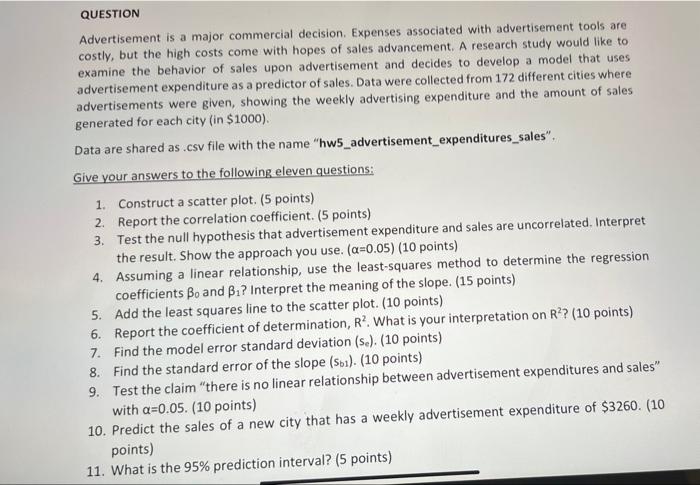
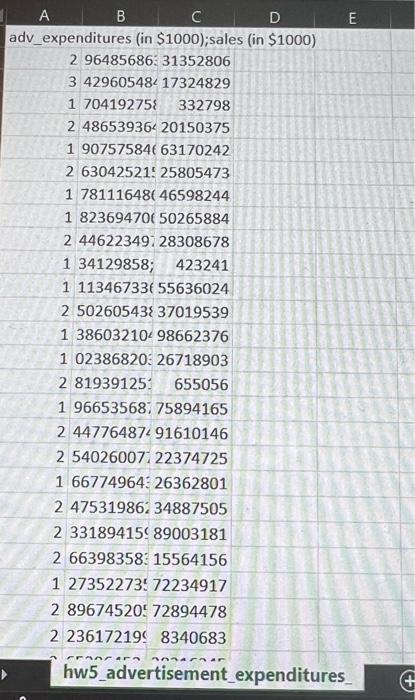
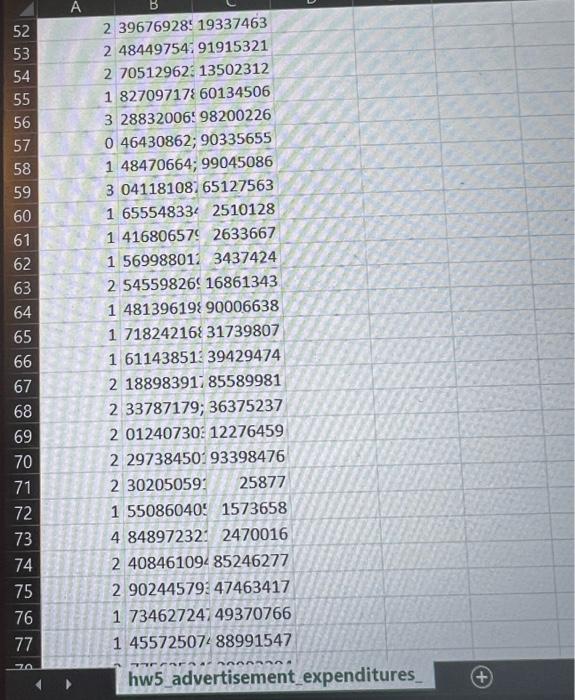
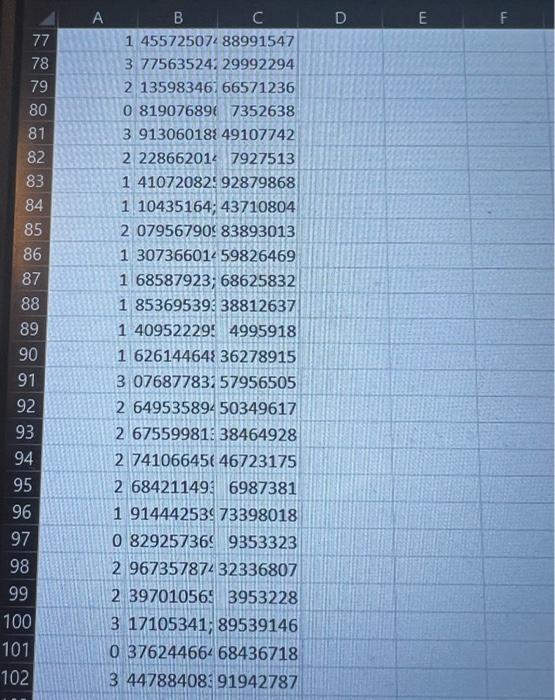
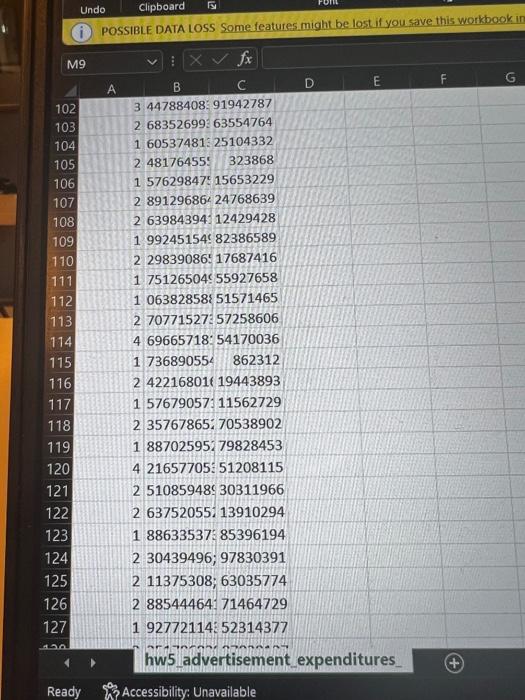
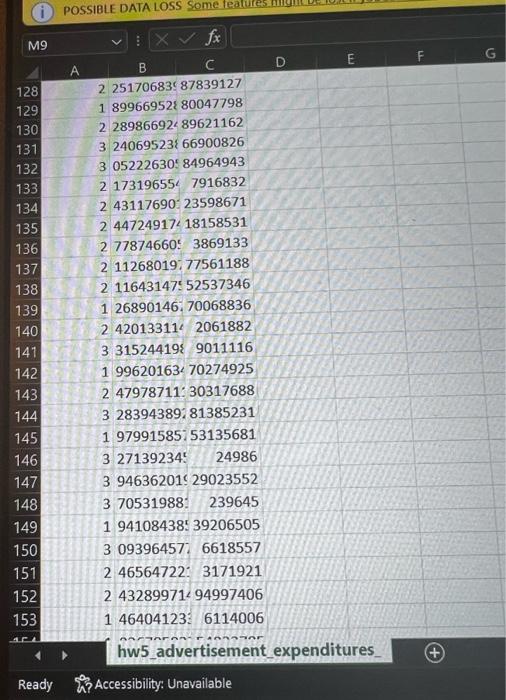
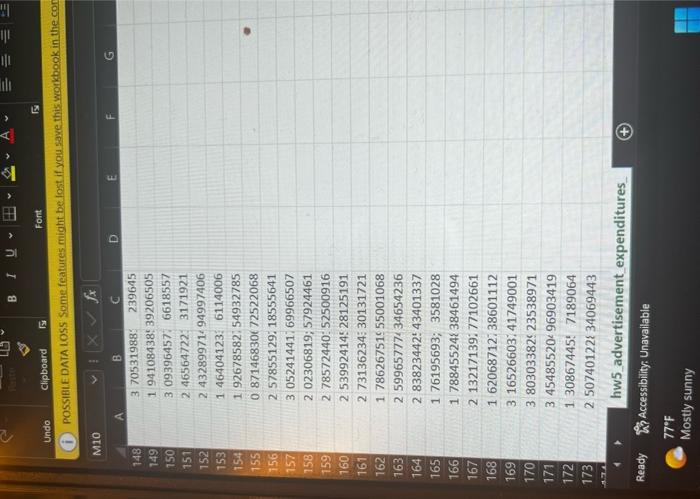
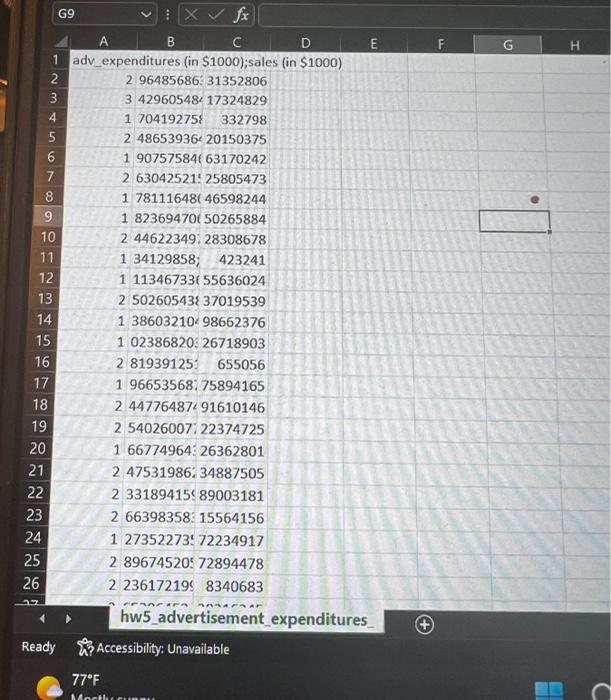
QUESTION Advertisement is a major commercial decision. Expenses associated with advertisement tools are costly, but the high costs come with hopes of sales advancement. A research study would like to examine the behavior of sales upon advertisement and decides to develop a model that uses advertisement expenditure as a predictor of sales. Data were collected from 172 different cities where advertisements were given, showing the weekly advertising expenditure and the amount of sales generated for each city (in $1000). Data are shared as .csv file with the name "hw5_advertisement expenditures_sales". Give your answers to the following eleven questions: 1. Construct a scatter plot. (5 points) 2. Report the correlation coefficient. (5 points) 3. Test the null hypothesis that advertisement expenditure and sales are uncorrelated. Interpret the result. Show the approach you use. (a=0.05) (10 points) 4. Assuming a linear relationship, use the least-squares method to determine the regression coefficients Bo and B? Interpret the meaning of the slope. (15 points) 5. Add the least squares line to the scatter plot. (10 points) 6. 7. 8. Report the coefficient of determination, R. What is your interpretation on R2? (10 points) Find the model error standard deviation (s.). (10 points) Find the standard error of the slope (S1). (10 points) Test the claim "there is no linear relationship between advertisement expenditures and sales" with a=0.05. (10 points) 10. Predict the sales of a new city that has a weekly advertisement expenditure of $3260. (10. 9. points) 11. What is the 95% prediction interval? (5 points)
Step by Step Solution
3.45 Rating (165 Votes )
There are 3 Steps involved in it
Here are the stepbys... View full answer

Get step-by-step solutions from verified subject matter experts