

Question: Please draw a box and whisper plot with the numbers provided. d) Give a 5 point summary of the given data and Draw a Box
Please draw a box and whisper plot with the numbers provided.
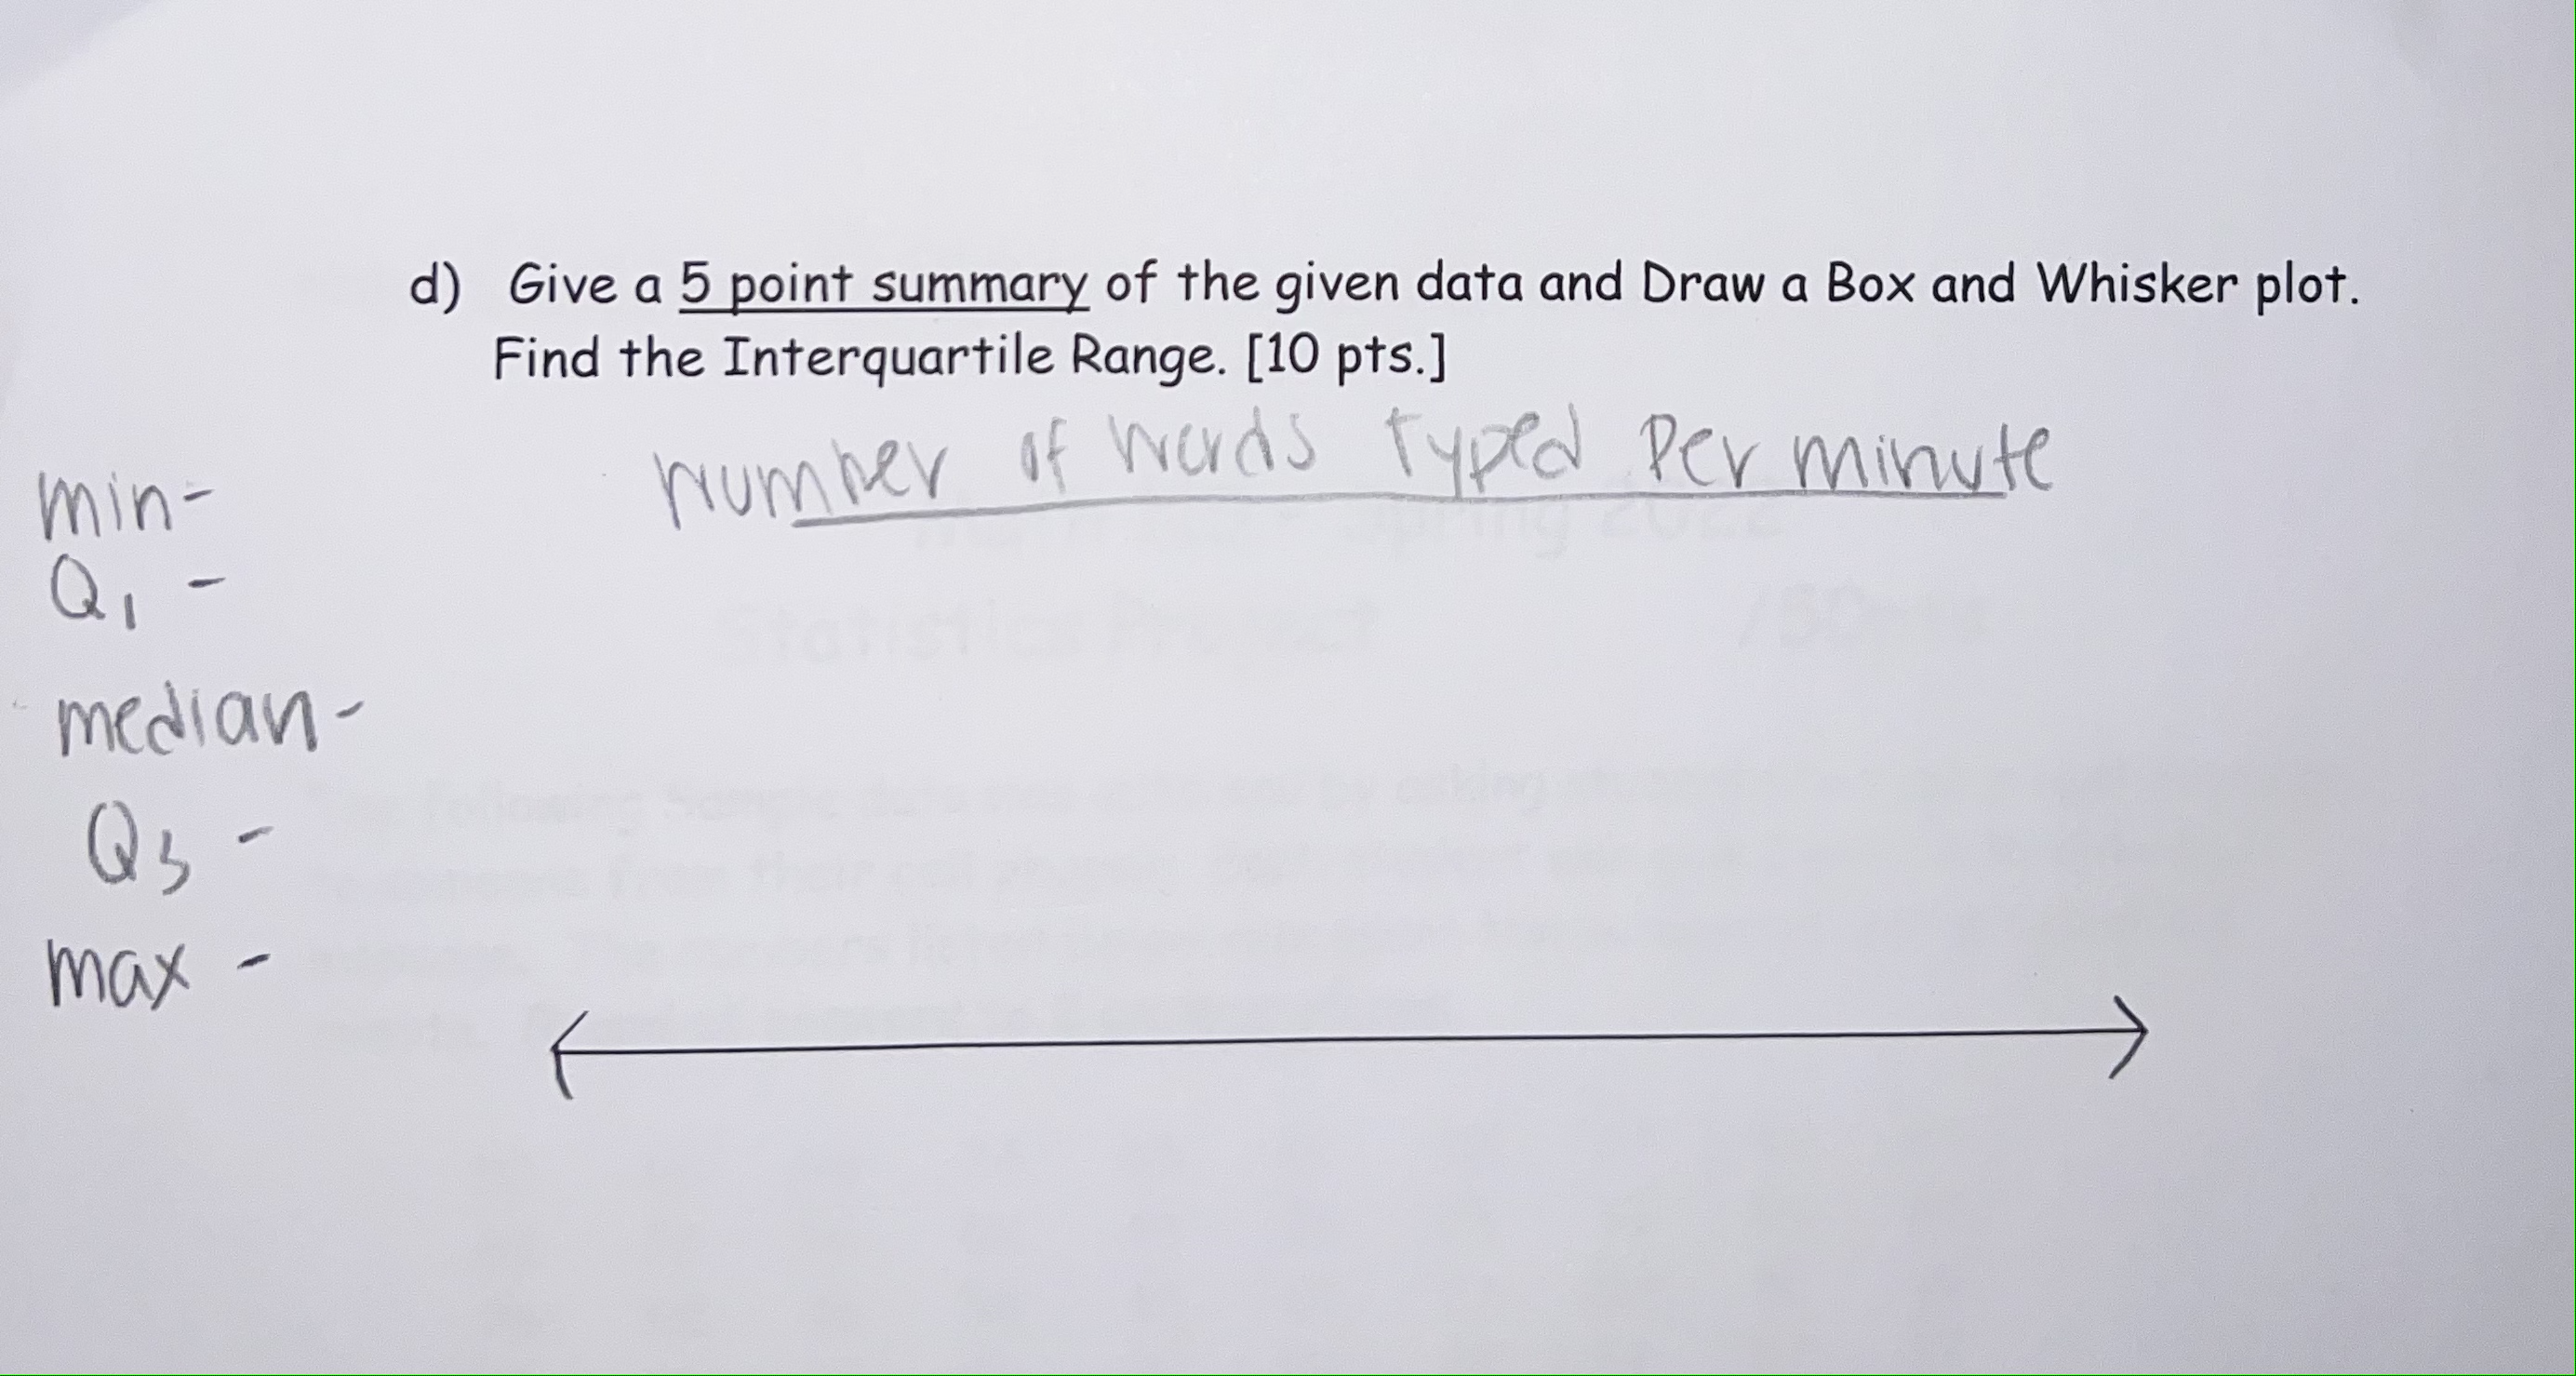
![a Box and Whisker plot. Find the Interquartile Range. [10 pts.] min](https://s3.amazonaws.com/si.experts.images/answers/2024/06/6677757642ea1_88566777575e89a3.jpg)
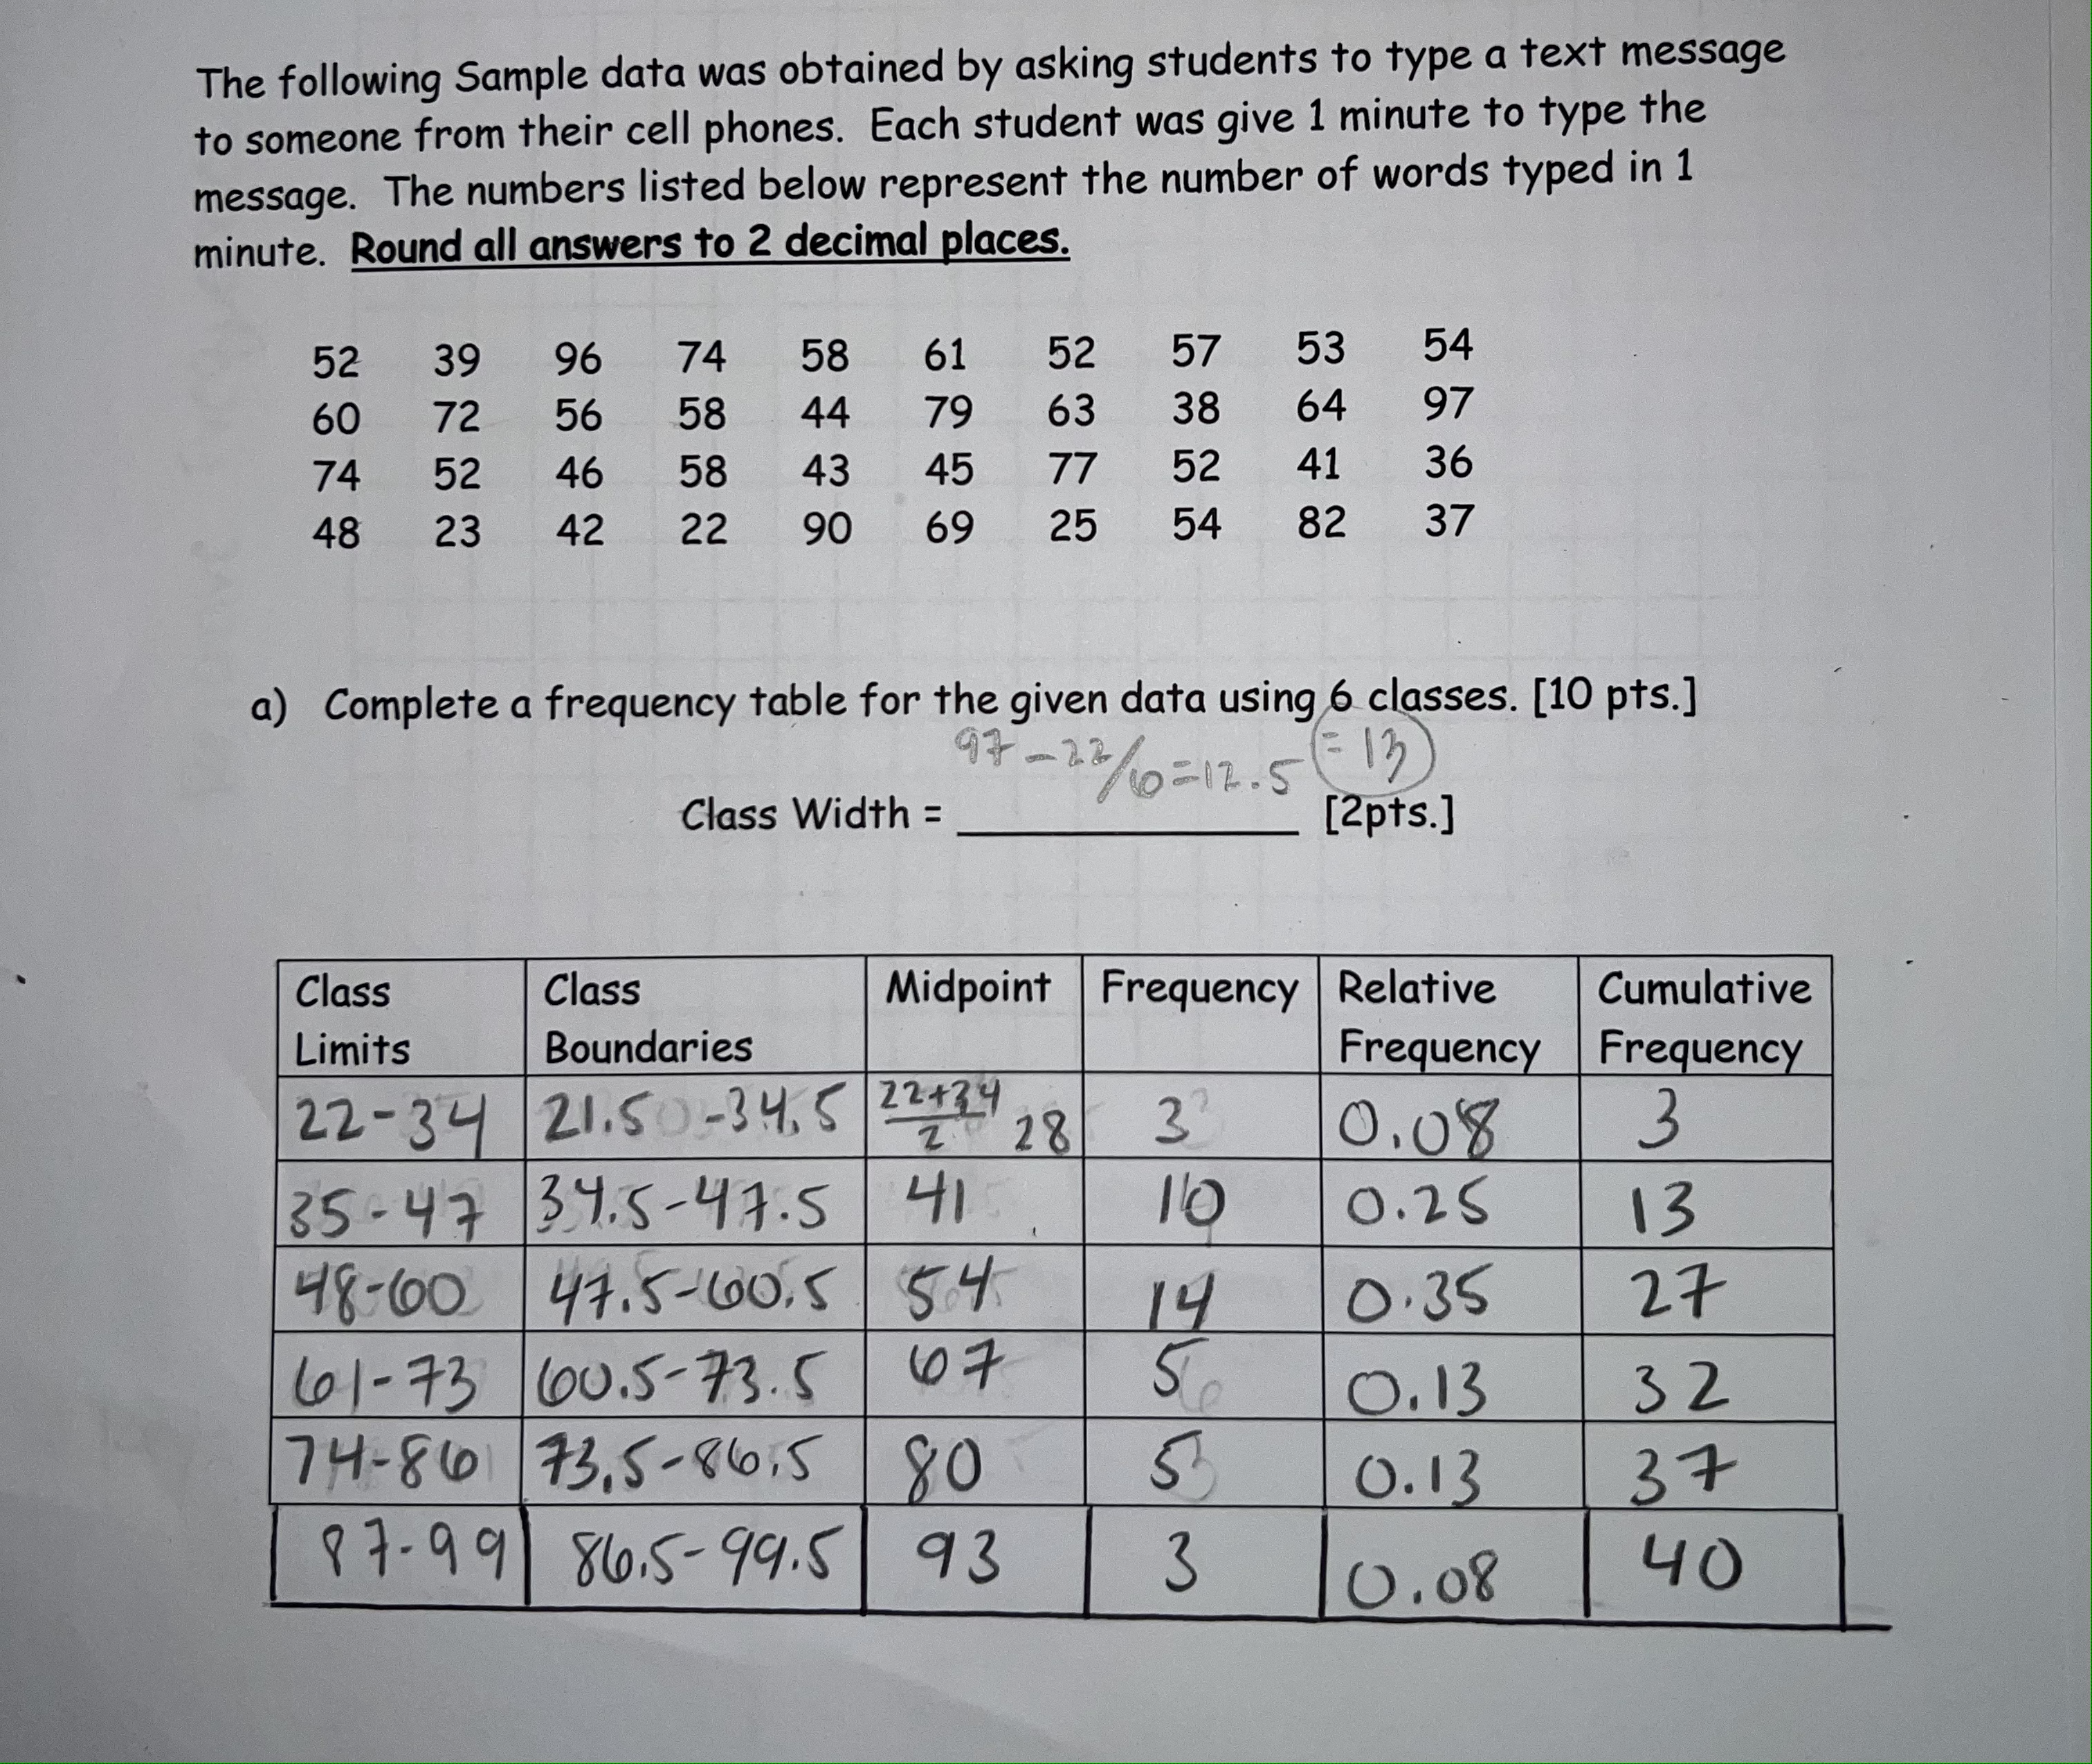
d) Give a 5 point summary of the given data and Draw a Box and Whisker plot. Find the Interquartile Range. [10 pts.] min - number of words Typed Per minute Q 1 - median- Q3 - max -The following Sample data was obtained by asking students to type a text message to someone from their cell phones. Each student was give 1 minute to type the message. The numbers listed below represent the number of words typed in 1 minute. Round all answers to 2 decimal places. 52 39 96 74 58 61 52 57 53 54 60 72 56 58 44 79 63 38 64 97 74 52 46 58 43 45 77 52 41 36 48 23 42 22 90 69 25 54 82 37 a) Complete a frequency table for the given data using 6 classes. [10 pts.] 47 -28/10=12.5 - 13) Class Width = [2pts. ] Class Class Midpoint Frequency | Relative Cumulative Limits Boundaries Frequency Frequency 22- 34 21.50 -345 22+34 2 28 0.08 3 35- 47 37.5- 47.5 41 110 0. 25 13 48-60 47. 5- 60.5 5.4 14 0.35 27 61-73 /60.5- 73.5 607 5 0. 13 32 74 - 86 73, 5- 86:5 80 0.13 37 87- 99 86.5- 99.5 93 3 0. 08 40
Step by Step Solution
There are 3 Steps involved in it

Get step-by-step solutions from verified subject matter experts