

Question: Please draw a concentration vs. time graph. Requirements for the graph: 1. Use hand to draw the graph, not excel. 2. Draw a smooth curve
Please draw a concentration vs. time graph.
Requirements for the graph:
1. Use hand to draw the graph, not excel.
2. Draw a smooth curve using pencil on the scatter graph.
2. Use hand to draw Tangent line and choose one spot to find the (x,y) then calculate the slope.
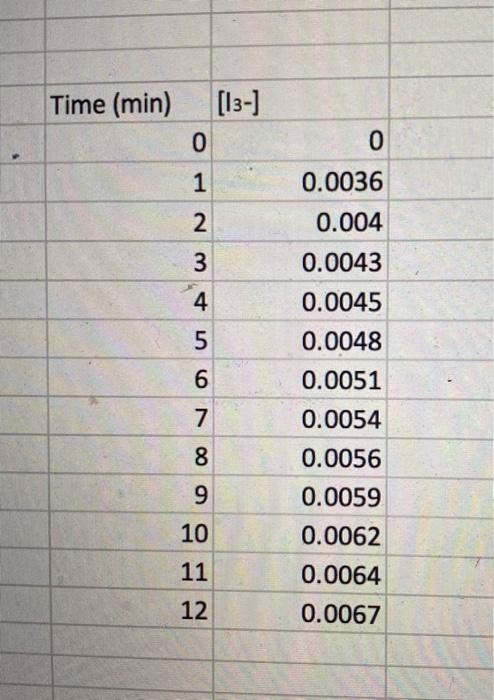
Time (min) \begin{tabular}{rr} {[13]} & \\ 0 & 0 \\ 1 & 0.0036 \\ 2 & 0.004 \\ \hline 3 & 0.0043 \\ 4 & 0.0045 \\ 5 & 0.0048 \\ 6 & 0.0051 \\ 7 & 0.0054 \\ 8 & 0.0056 \\ 9 & 0.0059 \\ 10 & 0.0062 \\ 11 & 0.0064 \\ \hline 12 & 0.0067 \\ \hline \end{tabular}
Step by Step Solution
There are 3 Steps involved in it
1 Expert Approved Answer
Step: 1 Unlock

Question Has Been Solved by an Expert!
Get step-by-step solutions from verified subject matter experts
Step: 2 Unlock
Step: 3 Unlock