

Question: Please draw A scientist is studying how long a certain virus can survive in solutions of various concentration of alcohol, and gathered the following data:
Please draw
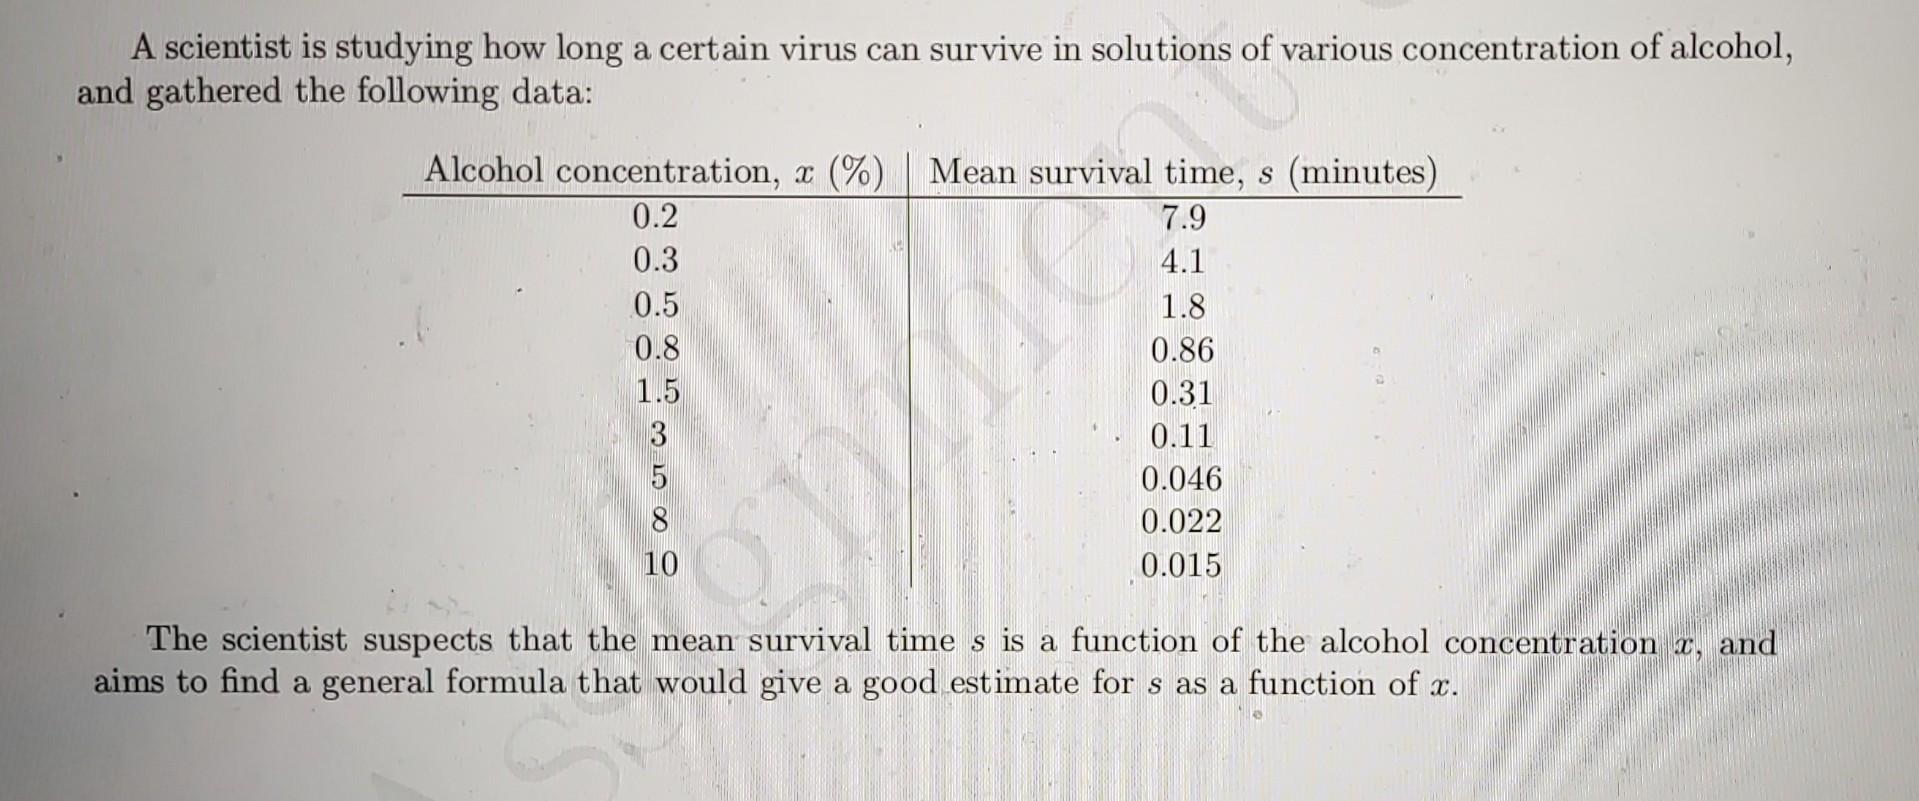
A scientist is studying how long a certain virus can survive in solutions of various concentration of alcohol, and gathered the following data: The scientist suspects that the mean survival time s is a function of the alcohol concentration x, and aims to find a general formula that would give a good estimate for s as a function of x. 2. (10 pts) Plot the given data on the following semi-log grid, using alcohol concentration as the independent variable. Your plot should contain a descriptive title, the appropriate units, and proper labels for the axes. 3. (10 pts) Plot the given data on the following log-log grid, using alcohol concentration as the independent variable. Your plot should contain a descriptive title, the appropriate units, and proper labels for the axesStep by Step Solution
There are 3 Steps involved in it
1 Expert Approved Answer
Step: 1 Unlock

Question Has Been Solved by an Expert!
Get step-by-step solutions from verified subject matter experts
Step: 2 Unlock
Step: 3 Unlock