

Question: Please draw an options graph to show me how to get the table's data. Problem 11.10. Suppose that put options on a stock with strike
Please draw an options graph to show me how to get the table's data.
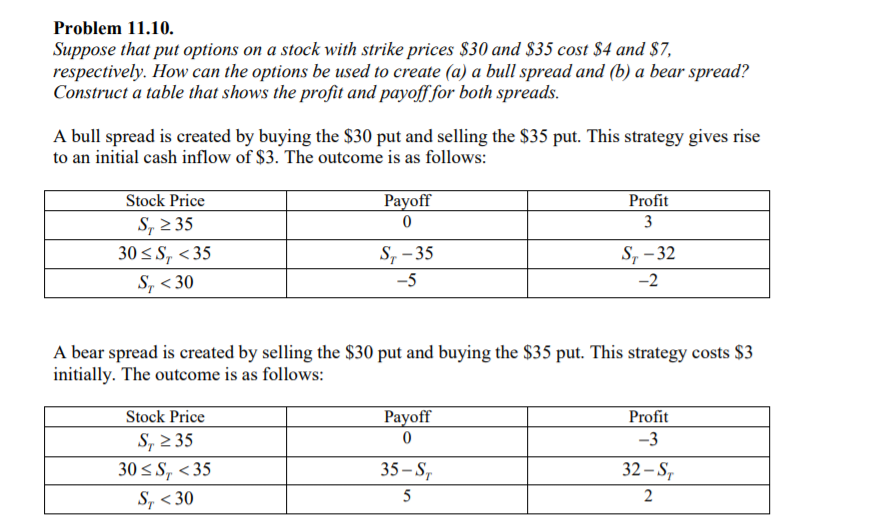
Problem 11.10. Suppose that put options on a stock with strike prices $30 and $35 cost $4 and $7, respectively. How can the options be used to create (a) a bull spread and (b) a bear spread? Construct a table that shows the profit and payoff for both spreads. A bull spread is created by buying the $30 put and selling the $35 put. This strategy gives rise to an initial cash inflow of $3. The outcome is as follows: Payoff 0 Profit 3 Stock Price S, 235 30 SS,
Step by Step Solution
There are 3 Steps involved in it
1 Expert Approved Answer
Step: 1 Unlock

Question Has Been Solved by an Expert!
Get step-by-step solutions from verified subject matter experts
Step: 2 Unlock
Step: 3 Unlock