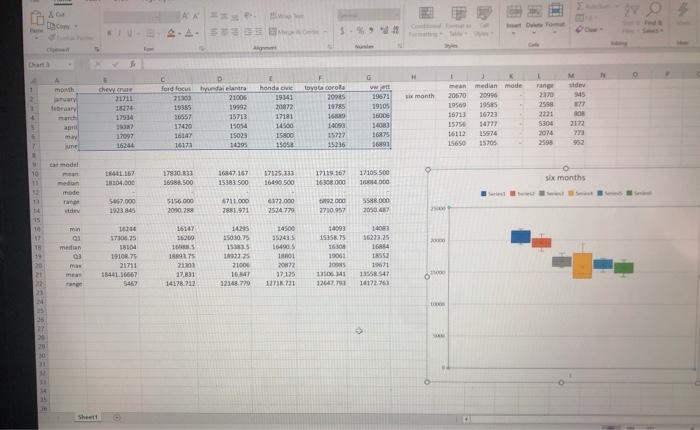
Question: please draw and explain how to draw box plot, and using which data to draw box plot? is the second picture right for six months?

please draw and explain how to draw box plot, and using which data to draw box plot? is the second picture right for six months? thank you! please draw and explain how to draw box plot, and
please draw and explain how to draw box plot, and
The spreadsheet entitled Compact Cars has sales data for six of the top car models, over a six month period in 2018. We do not have sales for the whole of 2018 year, meaning the data we have at hand is a sample of the 2018 whole year population data. For the entire 2018 year, our goal is to test, whether the mean number of car types sold is substantially different for the six models and whether the mean number of cars sold per month is substantially different between the months. At this point in time we are new to data analytics and are not aware of any specific tests to find the answer. As such we want to infer the answers for the entire 2018 year to the questions above, from the sample data. Phase 1 report must include the preliminary findings: 1. What are the means, medians, modes, range and standard deviation for each of the six car models? Draw box plots. 2. What are the means, medians, modes, range and standard deviations for each of the six months (January - June)? Draw box plots. 2-4. E 6%-5 Dat N O d 1 chew ww 19671 21711 month $45 Juanud Tord focus tunda elantra 2100 21006 19385 1992 15711 17420 15054 15023 1617 1430 honda 19141 20072 17101 14500 15800 toyota corolla 2005 1978 1 1409 15727 PEOLT 20670 19560 15713 15754 16112 15650 median mode 20990 1955 16723 3471 3594 35705 ng 2370 2598 22:31 5304 2014 19105 16000 140 16875 1691 3 22 at may 16 17097 16244 15216 952 7 1 an tamodel O 10 11 18441.167 100.000 17830.833 1638. O 16847.157 15383 500 17125 133 16090.500 1711167 16308000 17105.500 14000 six months mode na 5467.000 1923 845 5156.000 2000 788 6711.000 2881.971 6172.000 253477 92.000 2710957 5588 000 2050. the 15 16 Toin PEN 16147 10000 14500 TB men 14215 3503075 1585 1972 21004 14093 15355 16304 19001 17:06 14 191087 2171 1844L16667 352435 16400 101 ED SALON 1403 16233.25 16854 TS 11 13553547 14122.761 20 SOE ma ME 21001 131 17.125 1231 14 12647,793 14.78.712 123.779 N 22 10

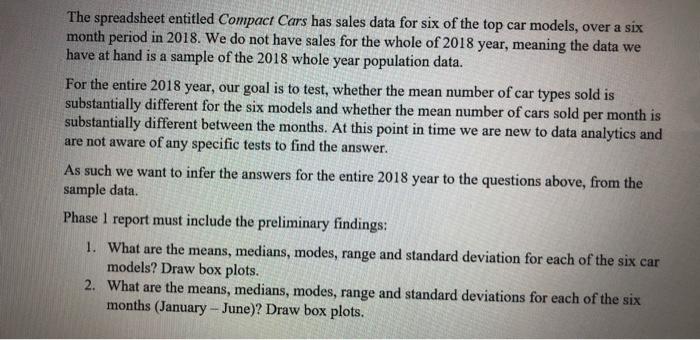
Step by Step Solution

There are 3 Steps involved in it

1 Expert Approved Answer
Step: 1 Unlock blur-text-image
Question Has Been Solved by an Expert!

Get step-by-step solutions from verified subject matter experts

Step: 2 Unlock
Step: 3 Unlock

Students Have Also Explored These Related General Management Questions!